• Market-backed decisions
  • Expert guidance, zero guesswork

Make data-driven decisions and scale your profitability

Our short-term rental market insights give you a real competitive edge. With ListingOK's Market Insights you’ll discover where, when, and how to grow profitably — powered by actionable data, our StayProfit® algorithm, and the guidance of senior revenue managers.

No commitment · 1st reply < 2h
Average rating 4.9/5 (consolidated) 150+ properties optimized
Short-Term Rental Market Insights — ListingOK
Short-Term Rental Market Insights — performance — ListingOK

Multiply your revenue with ListingOK Market Insights

Short term rental analysis meets expert support: turn market data into better pricing, better investments, and smarter decisions.

Identify tourist areas with the highest growth potential
We analyze over 500 destinations to highlight emerging neighborhoods, future developments, and key seasonality — before your competitors do.
Understand how much you can earn before you invest or sign a new contract
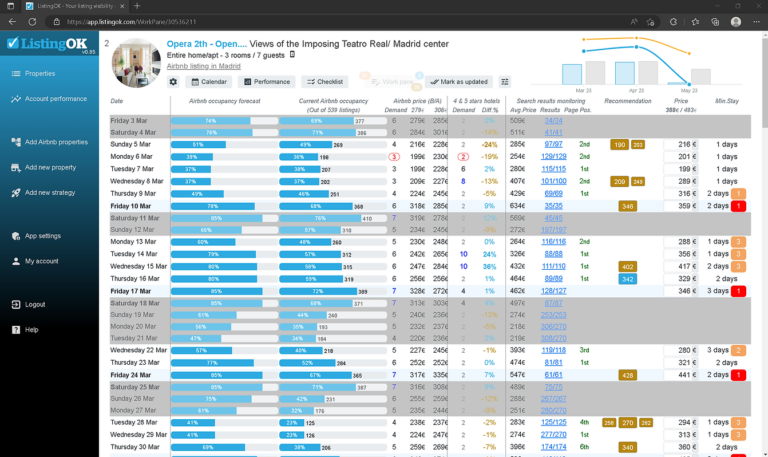
ADR, occupancy, and RevPAR projections based on historical data and our predictive algorithm StayProfit, fine-tuned with 10 years of real data.
Leverage the strategic vision of local revenue managers
Our team compares your goals with actual market dynamics and translates the data into a practical, profitable action plan.

From intuition to actionable data in minutes

You receive a ready-to-implement short term rental analysis report and expert support that transforms numbers into profitable action.

Methodology guided by revenue managers, not just technology.

We kick off by defining objectives and variables, then interpret every metric through the lens of local expertise and operational context.

Report delivery + customized strategy session

Includes profitability maps, “what-if” simulations and a 12-month plan, explained step by step by your dedicated revenue manager.

Work pane and insights — ListingOK

What you get with each Short-Term Rental Market Insights report

-

Map of opportunities by area, asset type and expected demand.

Instantly pinpoint high-potential neighborhoods and property types to invest where demand is growing.

Map of opportunities by area, asset type and expected demand.

Comparison of price, occupancy and pacing against your competitive set.

See where you stand in the market and adjust before your competitors catch up.

Comparison of price, occupancy and pacing against your competitive set.

Net revenue simulation (ADR, RevPAR, GOP) for up to 3 scenarios.

Run simulations to test pricing and occupancy strategies before deploying capital or making operational changes.

Net revenue simulation (ADR, RevPAR, GOP) for up to 3 scenarios.

Channel mix recommendations and minimum stay policies.

Optimize your distribution mix and minimize OTA dependency by applying the right rules per channel and season.

Channel mix recommendations and minimum stay policies.

Checklist of investments and improvements with estimated return.

Prioritize renovations and purchases with an ROI-backed plan that turns each euro invested into measurable profit.

Checklist of investments and improvements with estimated return.

Key use cases

Open a new market

Assess viability by area with opportunity maps and true comparable comp-sets.

Show me my case

Renegotiate owner contracts

Seasonal, realistic targets backed by defendable metrics.

Show me my case

CapEx planning

Prioritize improvements that lift ADR, RevPAR and GOP net profit.

Show me my case

Get Market Insights for your area Talk to an expert Request demo

How we deliver your short-term rental market insights

Define

30 min kick-off to align goals, markets and level of detail.

Collect

Extraction and cleaning of data on demand, competition and prices.

Model

Predictive forecasting with StayProfit (ADR, occupancy, RevPAR).

Interpret

Review of senior revenue managers to refine recommendations.

Deliver

PDF report along with an interactive web dashboard ready to share and visualize your insights.

Implement

60 min workshop and subsequent support to put the plan into action.

Dynamic pricing with logic, not surprises

What others offer

  • Standard radius or automated borders defined in-app
  • Algorithms that pull public listings without property equivalence
  • Gross revenue projections or single-scenario KPIs
  • Focus only on short-term pricing and occupancy
  • Self-service help, webinars or upsold consultancy
  • Basic PDF/CSV exports from dashboards
Risk of misconfiguration Time lost learning tools

What we do at ListingOK

  • We manually define neighborhoods based on demand, regulation and access
  • Hand-curated comp-sets: only truly comparable properties
  • Net revenue simulations (ADR, RevPAR, GOP)
  • Investment opportunity maps, optimal channel mix, ROI estimates
  • A revenue manager explains the report in a 60-min workshop
  • Executive PDF + interactive dashboard + action plan
Average rating 4.9/5 (consolidated) 150+ properties optimized Fast onboarding
Request a demo No commitment. ✨

Frequently asked questions about Market Insights

Everything you need to know before requesting your report

Pricing depends on the number of areas analyzed, the size of the comparable set, and the requested depth (e.g., extra scenarios or asset-type splits). Entry packages typically cover 1–2 areas with a representative comp-set. Book a demo to receive a fixed proposal aligned to your goals and timeline.

We recommend quarterly updates for seasonal destinations and monthly updates in fast-moving markets. Order an ad-hoc refresh when opening new units, renegotiating contracts, or ahead of major local events.

No. The report can be produced without any technical integration. If you wish, we can connect to your PMS/CM to enrich the analysis with first-party data and validate parity, availability and rules.

We combine public inventories, demand signals (search, pacing, seasonality), audited scrapes and, when applicable, aggregated PMS/CM data. Quality checks, deduplication and property equivalence ensure the comp-set is truly comparable.

Typical delivery time is 5–10 business days from kick-off, depending on scope. For integrations or extra scenarios, we provide a detailed schedule before we start.

Yes. We can cover multiple neighborhoods, municipalities or cities. We include sample size per area and separate opportunity maps to help you prioritize.

We select comparables by property type, capacity, location, finish, reviews and distribution strategy. We exclude outliers and validate extreme prices to avoid biasing ADR and RevPAR.

A 60-minute workshop to present the report, answer questions and agree on a 90-day plan. Ongoing support via email/WhatsApp and follow-up packages to implement changes and measure impact.

They entrusted their revenue strategy to ListingOK.

“Self-management tools left me alone with charts. With ListingOK I have a Revenue Manager who does everything and explains every step. Real results—without complications.”

Carlos R
Carlos R Manager with 28 properties on the Costa Brava

“I now get clear, objective reports to communicate with owners and investors. It’s not just occupancy—it’s profitability with vision.”

Andres T.
Andres T. Co-founder of 70-unit management company

“Everything is clear from day one—no small print, no surprises—and revenue has improved month after month.”

Patricia M
Patricia M Management company with 25 properties in Spain