See why guests aren't finding your Airbnb.
Paste your Airbnb link. We search Airbnb like a guest across your upcoming nights, then show you where you rank, which nights are priced wrong, and what to fix first.
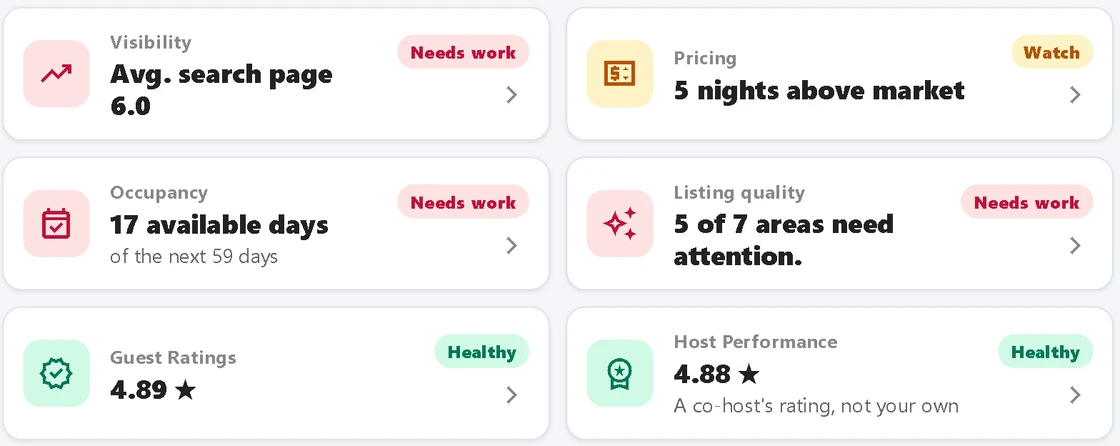
How it works
From URL to actionable insights in 3 simple steps
Paste your link, confirm your email
Paste the link to any Airbnb listing, then confirm your email. No password, no card.
We run real searches
Our engine runs simulated searches on Airbnb, measuring rank and pricing across upcoming dates.
Get your report in a couple of hours
Real searches take real time — that's why the numbers are measured, not estimated. We email you the link the moment it's ready.
What your analysis includes
A deep one-time analysis — and continuous monitoring after, so the work you do today doesn't quietly unravel.
Six full analyses, no subscription needed
The visibility check is free: we tell you on how many of your upcoming days guests find you on the first page of Airbnb search. The full report is a one-time $9.
Search Ranking Analysis
Understand exactly where your listing appears when guests search for accommodation in your area.
- Position tracking across multiple upcoming dates
- Comparison with the listings nearby
- Trend tracking across report history
Listing Quality Analysis
Get a detailed evaluation of your photos, guest reviews, and listing content with specific improvement actions.
- Your photos reviewed one by one, up to 25
- Guest review sentiment and flagged concerns
- Title, description, amenities, house rules and search keywords
Performance Comparison
See how your ratings and occupancy compare with the listings nearby.
- Guest and host ratings against the listings nearby
- Your open days against the area average
Area Market Statistics
Understand your local market with historical data, trend charts, and a breakdown of the listings nearby.
- Monthly revenue, occupancy and average nightly price charts
- How many listings nearby accept 1, 2, 3 or 4+ night stays
- Area benchmarks: average price, income, and occupancy
Price & Min-Stay Analysis
Discover pricing gaps and minimum-stay settings that are limiting your search visibility.
- Comparison with the area's prices
- The nights your minimum stay blocks, by date
- Nights priced above or below what their demand supports
Calendar Coverage
See your availability and search position day by day over the next 4 months.
- 4-month calendar grid view
- Availability + pricing per day
- Gap detection for high-demand dates
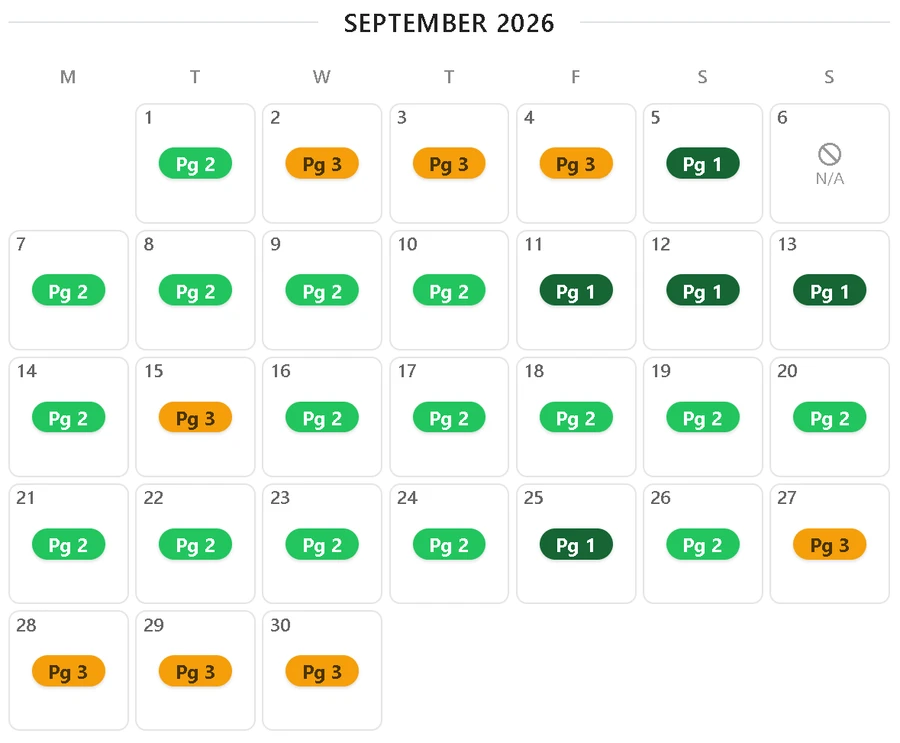
One month from a live report. Each square is the search page your listing landed on that day.
14 alerts that catch what would silently cost you bookings
We measure your search position almost every day, and every Monday we send you a fresh report with any of these that tipped over — long before you'd notice in your bookings.
Real fixes from a real report
Three fixes from this week's live report, exactly as the host reads them.
Title sells the location but says nothing about the apartment itself
Change your title to "Quiet Renovated Apartment Near Royal Palace" (43 characters), keeping the Royal Palace landmark while adding the renovation and tranquility angles your description already makes.
Recurring lift, low-ceiling, AC and sewage-noise complaints go unmentioned
Add these four sentences to the 'Other things to note' section: 'The apartment is on the 5th floor and the building lift is occasionally out of service, so stairs may sometimes be needed. The attic ceilings are sloped and low in places, which taller guests should keep in mind. Air conditioning performance can vary between rooms on the hottest days. A grinder in the building's sewage system can be audible at night in the bedroom next to the bathroom.'
Raise your price on 3 nights — the biggest gaps, below what demand supports
Raise the nightly price on the flagged dates in your Airbnb calendar. Where the gap is wide, move up in steps rather than in one jump.
Some nights your area sells out. Others it doesn't.
Your report scores every one of the next 120 nights by how full the area around you is — so you see the busy nights while there's still time to price for them.

One week from a live report.
Each square carries the estimated occupancy of the listings around you on that exact date.
In the week above, the area climbs from 48% full on the Monday to 91% on the Friday — a swing no monthly average would ever show you.
Your nightly price and what places nearby are asking share the cell, so a busy night priced like a quiet one stands out.
Two ways to get started.
Check it free
Paste your Airbnb URL and we'll tell you on how many of your upcoming days guests find you on the first page of search.
Skip to monitoring
We measure your search position almost every day, and every Monday we email you what changed: ranking, ratings, calendar gaps.
Watch my listing 7-day refund. Cancel anytime.Frequently Asked Questions
Everything you need to know about your report and how we monitor your listing
What do I get, and what is free?
Six full analyses of your listing: where you rank in Airbnb search day by day, your pricing compared with listings nearby (including the specific dates worth raising or lowering), an AI review of your photos, description and guest reviews, your occupancy against the area average, and 12 months of market trends. It all rolls up into a prioritized action plan you can work through. The visibility check is free: we tell you on how many of your upcoming days guests find you on the first page of Airbnb search. The full report is a one-time $9.
Do I need an account or a credit card?
No card to run the check. Paste your link, confirm your email, and your report is ready in a couple of hours. We email you the link. The visibility check is free.
Can Airbnb tell I'm running these checks? Will it affect my listing?
No. We search Airbnb the way a guest would, from our own infrastructure — we never log in as you, touch your listing, or interact with your account. To Airbnb it's ordinary search traffic, so there's no effect on your ranking. (Repeatedly searching for your own listing yourself can bias what you see — that's exactly why we check from the outside.)
How do you monitor my listing's position on Airbnb?
We run automated searches on Airbnb.com in your area, filtered to a minimum number of bedrooms that your report shows (for example, 2+). We then record where your listing appears.
Why does my position fluctuate?
Search results are dynamic. They change with time of day, browser, device, and Airbnb's own testing. Airbnb sometimes promotes listings temporarily, then lowers them if they don't generate bookings. Frequent self-searches can also cause your listing to disappear from your own results.
Why does your report sometimes show me on page 3, but I can't find my listing?
Airbnb personalizes and rotates results. To avoid this bias, we monitor with different browsers, times, and conditions. Your own search may not always match the broader market view, which is why our independent monitoring is more reliable.
What search radius do you use?
The radius depends on listing density. In areas with many Airbnbs, it may be only a few hundred meters. In areas with few, it may be several kilometers. The exact radius and number of listings analyzed are displayed in your report footer.
How often do you check my position?
We measure your search position almost every day. Your report charts up to the last 30 days, and subscribers get a fresh full report every Monday.
What will I actually do with the alerts?
The alert tells you exactly what to do. Three examples: (a) Monday's email says your ranking dropped a page — you check the listing, find a calendar block you forgot to clear, and clear it. (b) Your host rating slips to 4.79 — you find the guest who left the 3★ review and reply within the response window. (c) A pricing alert flags that you're 18% under the area median for a holiday weekend — you raise your price before it books. Without alerts, you find out from a slow month.
Do I have to pay every time I want a report?
Up to you. You can buy reports one at a time ($9 for a single report), or subscribe from $19/month and get a fresh report every Monday automatically. Both options are on the pricing page.