
Swipe to see more cities →
Airbnb occupancy in Croatia
Airbnb occupancy in Croatia by city: cross-read occupancy, nightly prices and earnings. Updated monthly.
Airbnb occupancy in Croatia by city
Explore Airbnb occupancy by city and spot seasonality patterns and nightly-price differences.
City performance: Airbnb occupancy & nightly price
Compare Airbnb occupancy, nightly price and estimated earnings to identify premium markets versus volume-led strategies.
Suggest a new city in Croatia
Methodology
We integrate supply, demand, prices and availability signals from multiple sources and internal crawls. We run cleaning, de-duplication and normalization to build comparable indicators across destinations.
Coverage & period
Nationwide coverage focused on demand-relevant cities. Metrics refer to the latest fully closed month.
Definitions
Airbnb occupancy
Booked nights as a percentage of available nights.
Average nightly price (ADR)
Average booked price per night.
Estimated revenue
Gross booking estimate (before local taxes).
How to use the data
Cross-read Airbnb occupancy and the average nightly price to understand price/volume trade-offs and adjust strategy by season.
Limitations
Aggregate estimates subject to inventory and mix dynamics. Use for strategy, not as a replacement for operational reporting.
Frequently asked questions about Airbnb occupancy in Croatia
Data is updated monthly with information from the most recent fully closed month. We currently cover 3 cities in Croatia.
Yes, all data uses the same consistent methodology, allowing direct comparisons between different cities. You can sort by occupancy, ADR or estimated revenue.
We include occupancy rate, ADR (average daily rate), estimated monthly revenue, best months, worst months and seasonality for each city.
Use the "Suggest a new city" form on this page. We will notify you by email when the city is available, typically within 72 hours.
Profitability varies by city. Check our comparison table to identify premium markets (high occupancy + high ADR) vs. volume strategies (high occupancy + low ADR).
Seasonality varies significantly between cities in Croatia. Tourist cities show more variation, while business cities are more stable. Review each city's data to plan your strategy.
We offer Revenue Management with dynamic pricing, Channel Manager to sync OTAs, and Market Insights for competitive analysis. All tools use local data from Croatia.
Airbnb occupancy is calculated over available nights (when the host accepts bookings), while hotels calculate over total inventory. This makes Airbnb rates generally higher.
Explore other countries

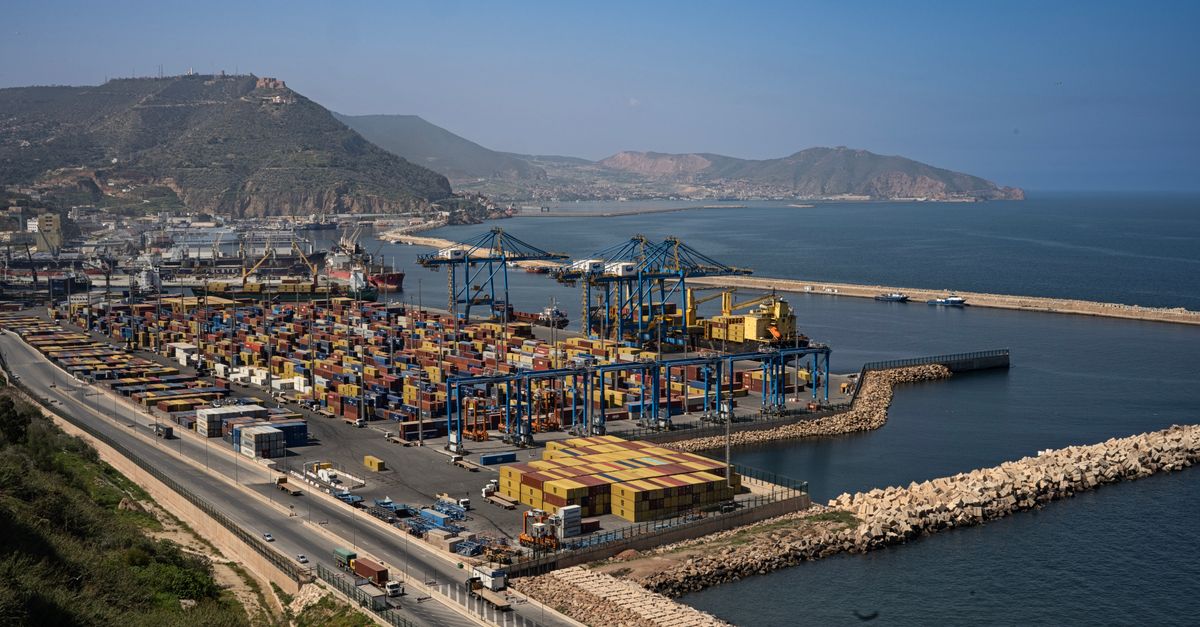




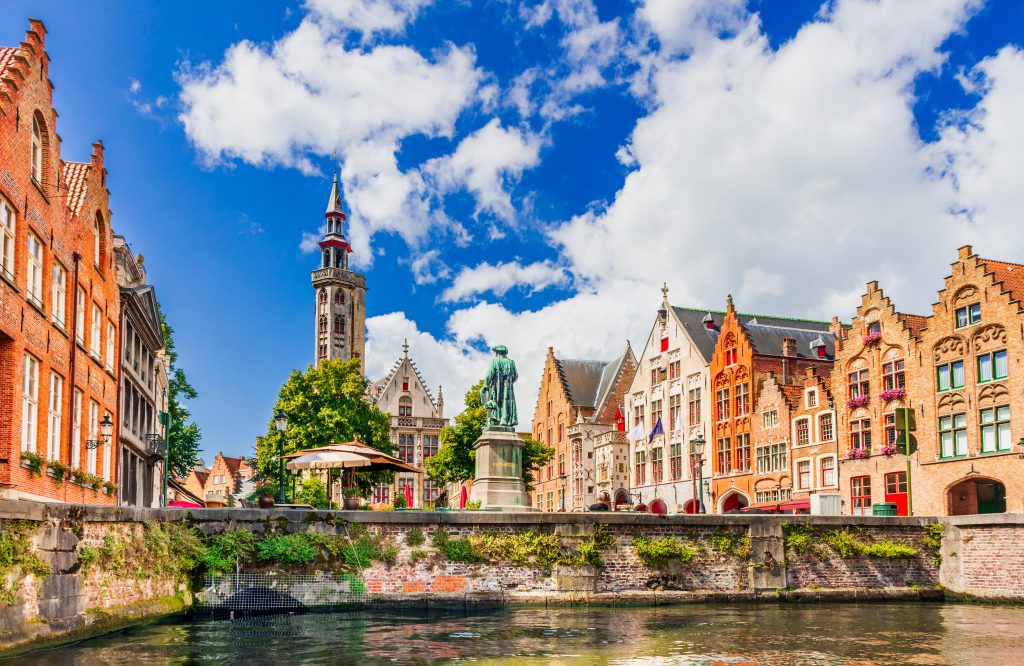
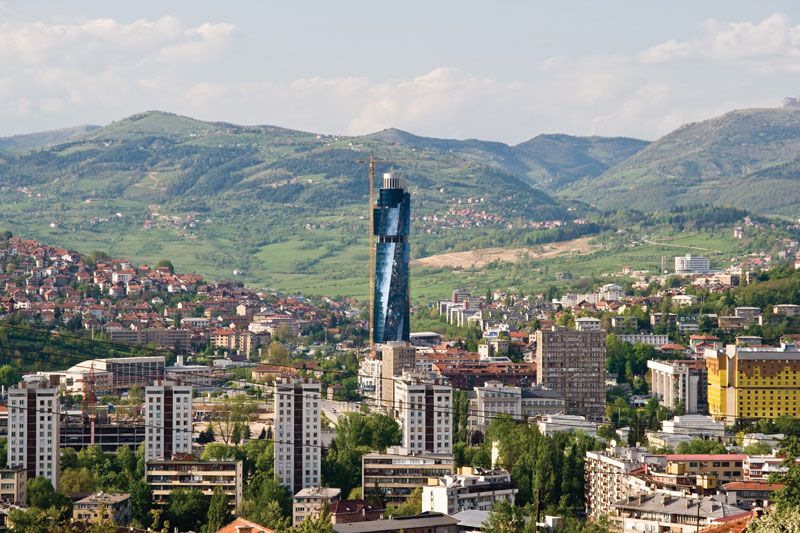












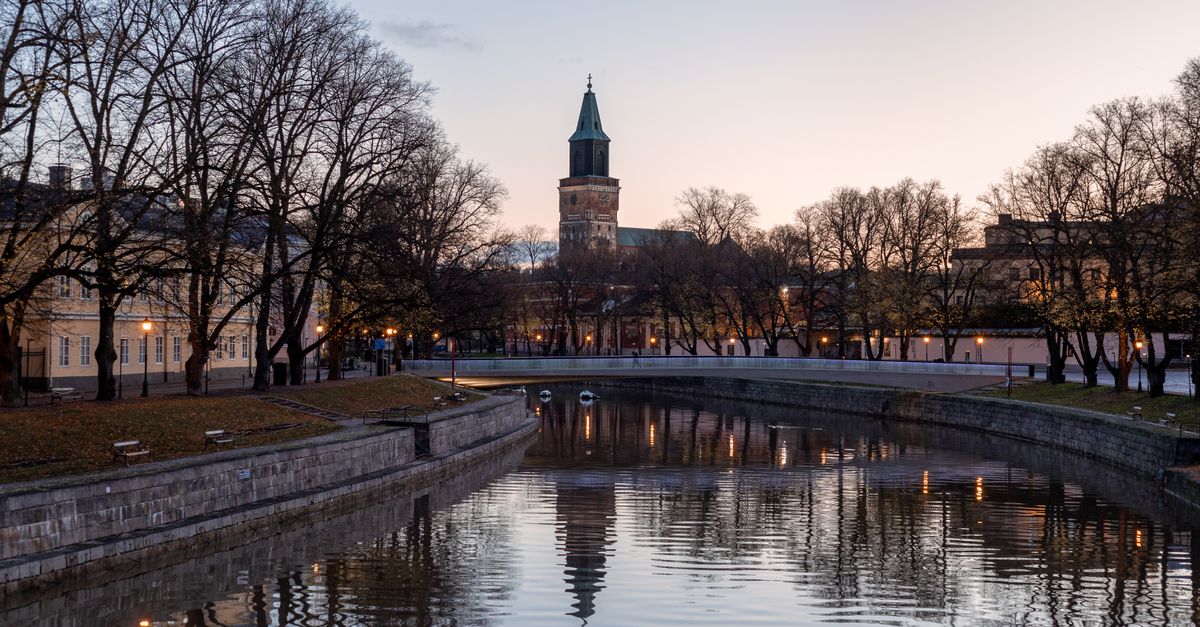

































Calculate your earnings potential in Croatia
Optimize your income with market data from Croatia and our revenue management system
Your listings
How do we achieve these results?
AI Dynamic Pricing
Occupancy Optimization
Market Analysis
24/7 Expert Support
In line with our best results!
Get your full report
Detailed analysis and personalized recommendations
* Calculations based on 30 days/month. Actual results may vary depending on market, season, property type, and implemented strategy.
Check your Airbnb in Croatia
And around the world