
Airbnb Occupancy Rate in Mexico City, Mexico, Data & Trends 2026
Curious about the performance of short-term rentals in Mexico City, Mexico? Over the last year, the average occupancy rate was 64% with an average nightly price (ADR) of 77€. Hosts earned on average 1410€ per month.

📩 Send me this report and get it in my inbox every month
90-day occupancy forecast for Mexico City so you can update rates and stay ahead of competitors.
Market summary in Mexico City
Key metrics to optimize your pricing strategy
Avg. monthly earnings
1410€
$1283 USD
YoY Revenue Change
5%
vs. previous year
Occupancy Rate
64%
~19 days/month
Average Daily Rate
77€
$70 USD
Seasonality Index
32%
demand variation
Best Months
June, December
peak season
Worst Months
September, January
low season
Revenue Management in Mexico City
Our AI-powered platform automatically optimizes your rates. Maximize your revenue with intelligent dynamic pricing.
What Mexico City's occupancy and nightly prices actually mean
Over the analysis period June 2025 to May 2026, Mexico City posted 65% average occupancy and 235 booked nights a year. That occupancy runs roughly 12 points above the seven-city Mexican national average of about 53%, and is the highest of any market in the country's dataset, including the resort destinations. The trade-off is rate: at an ADR of 72€ (about $65) it has the lowest nightly price of any Mexican city here, well under the national average near 97€.
The net result is average monthly revenue of 1,340€ (about $1,218) per listing, year-on-year revenue essentially flat at -1% (the most stable figure in the country), and the lowest seasonality reading at 31%. The takeaway for managers is clear: Mexico City rewards high, consistent utilisation rather than premium pricing, so the strategy is steady occupancy and longer stays, not high-season rate spikes.
Monthly Airbnb occupancy in Mexico City
Average occupancy rate by month in Mexico City, compared with the same month a year earlier.
| Month | Occupancy | Prior year |
|---|---|---|
| Oct 2025 | 70% | 70% |
| Nov 2025 | 69% | 71.8% |
| Dec 2025 | 68.5% | 62.8% |
| Jan 2026 | 60.4% | 63.4% |
| Feb 2026 | 70.3% | 73.7% |
| Mar 2026 | 60.7% | 70.2% |
| Apr 2026 | 64.2% | 66.5% |
| May 2026 | 61.9% | 59.6% |
| Jun 2026 | 60.1% | 64% |
| Jul 2026 | 55.1% | 60.8% |
| Aug 2026 | 61.8% | 62.5% |
Historical Airbnb occupancy in Mexico City (last 12 months)
📌 Historical trends reveal seasonal highs – plan accordingly.
Airbnb occupancy forecast in Mexico City (next 90 days)
These figures reflect real-time demand in Mexico City, helping you plan and price strategically.
Why people book Airbnbs in Mexico City
Mexico City is a year-round urban market rather than a beach-season destination, and that shapes its Airbnb demand. Guests are a broad mix: business travellers and corporate visitors drawn to a capital of over nine million, weekend tourists exploring the Centro Histórico, museums and Chapultepec, and a large and growing population of remote workers and digital nomads who anchored in Roma and Condesa after the pandemic and tend to book longer stays.
Unlike Mexico's coastal markets, demand here is driven by culture, food and business rather than sun and sea, so it holds up across the calendar. The city's status as a major air hub, its affordability for North American and European visitors, and a dense restaurant and gallery scene keep bookings steady on weekdays and weekends alike, which is why occupancy sits well above the national average despite comparatively modest nightly rates.
When Airbnb demand peaks in Mexico City
Mexico City's demand is remarkably flat compared with Mexico's resort cities, which is the single most important fact for a host here: the API reports a seasonality index of just 31%, against 70-98% in beach markets like Tulum, Puerto Vallarta and Cancún. You can run an apartment profitably twelve months a year rather than chasing a short high season.
The strongest months are December and November. November is lifted by Día de Muertos (1-2 November, with the Alebrijes and grand parade along Paseo de la Reforma in late October) and by the Formula 1 Mexico City Grand Prix the weekend before, both of which sell out hotels and push spillover into short-term rentals. December adds Christmas and Año Nuevo travel. The softest months are September (rainy season and a quieter post-summer lull) and June; the late-October to early-November window is the clear annual peak to price aggressively for.
Best neighbourhoods for short-term rentals in Mexico City
The short-term-rental map centres on a handful of contiguous districts. Roma (Roma Norte especially) and Condesa are the engine: walkable, café- and restaurant-dense, and the default base for tourists and digital nomads, with Condesa slightly greener and calmer around its parks and better suited to month-long stays, while Roma is livelier and commands strong nightly demand. Polanco is the upscale, polished option, drawing business travellers and higher-budget guests near luxury hotels and shopping.
Centro Histórico puts guests next to the Zócalo, museums and landmarks and works well for sightseeing-led stays, though it is quieter and less appealing at night. Coyoacán offers leafy colonial charm and museums but sits much further south, so it trades central convenience for character. For most hosts, Roma-Condesa delivers the most reliable occupancy, while Polanco supports the highest rates.
Short-term rental rules in Mexico City
Mexico City has tightened short-term-rental rules. Reforms published in April 2024 created a city Host Registry: every host must register and obtain a unique registration number for each property, hosts were given 90 days to enrol, and the registration must be renewed every two years. The headline restriction is a 180-day annual cap, a property may be offered for short stays for at most half the year, after which the platform permit is suspended until the following year.
In practice, enforcement has lagged: as of late 2024 the large majority of listings were still operating without a formal licence, and the framework continues to evolve. Treat compliance as the prudent baseline (register the property, track nights against the 180-day ceiling, and budget for applicable lodging tax) rather than assuming the rules will not be applied. This is general guidance, not legal advice; confirm current requirements with the city before listing.
Tools & strategies for Mexico City
Revenue Management in Mexico City
We help you increase revenue in Mexico City with pricing algorithms and active monitoring.
Learn moreDynamic Pricing in Mexico City
Our engine auto-adjusts prices based on demand and local events in Mexico City.
Learn moreChannel Manager in Mexico City
Manage listings on Airbnb, Booking.com and Vrbo in one place across Mexico City.
Learn moreCheck your Airbnb in Mexico
And around the world
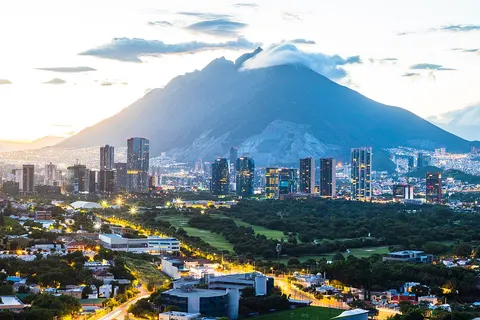
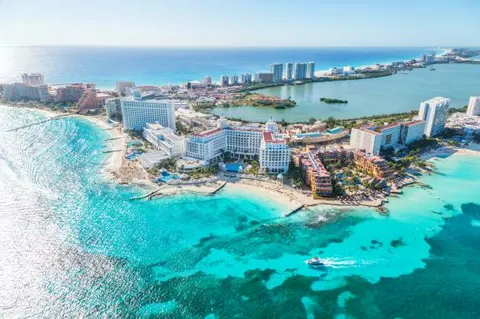
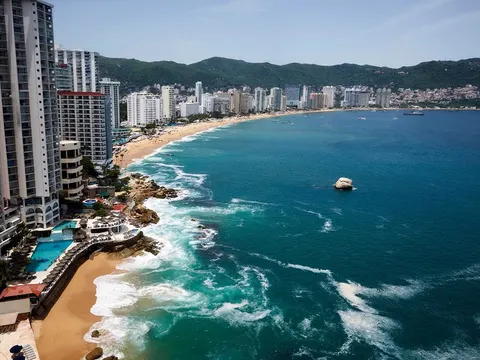
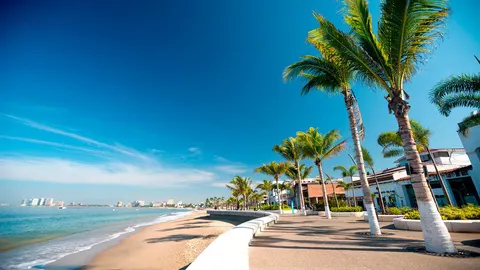
Other cities in Mexico
Compare performance across markets – occupancy, nightly prices and seasonality for other destinations in Mexico.

Calculate your earnings potential in Mexico City
Discover how much more you could earn by optimizing your listings with ListingOK
Your listings
How do we achieve these results?
AI Dynamic Pricing
Occupancy Optimization
Market Analysis
24/7 Expert Support
In line with our best results!
Get your full report
Detailed analysis and personalized recommendations
* Calculations based on 30 days/month. Actual results may vary depending on market, season, property type, and implemented strategy.
Suggest a new city in Mexico
Frequently asked questions about Airbnb occupancy in Mexico City
Average occupancy is about 65% over the June 2025 to May 2026 analysis period, equal to roughly 235 booked nights a year. That is the highest of any Mexican market in our dataset and around 12 points above the national average of about 53%, reflecting steady year-round urban demand rather than a short seasonal peak.
December and November are the strongest months. November benefits from Día de Muertos (1-2 November, with the grand parade in late October) and the Formula 1 Grand Prix the weekend before; December adds the holidays. With a low 31% seasonality index, the city pays year-round, but late October to early November is the clear window to raise rates.
Yes. Since April 2024 hosts must enrol in the city Host Registry, obtain a unique number for each property and renew every two years. A 180-day annual cap limits short-term letting to half the year. Enforcement has been patchy so far, but register and track your nights; confirm current rules with the city before listing.
Roma Norte and Condesa are the most reliable for occupancy, walkable and popular with tourists and digital nomads, with Condesa suited to longer stays. Polanco draws upscale and business guests at higher rates. Centro Histórico suits sightseeing visitors, and Coyoacán offers colonial charm but lies further from the centre.