
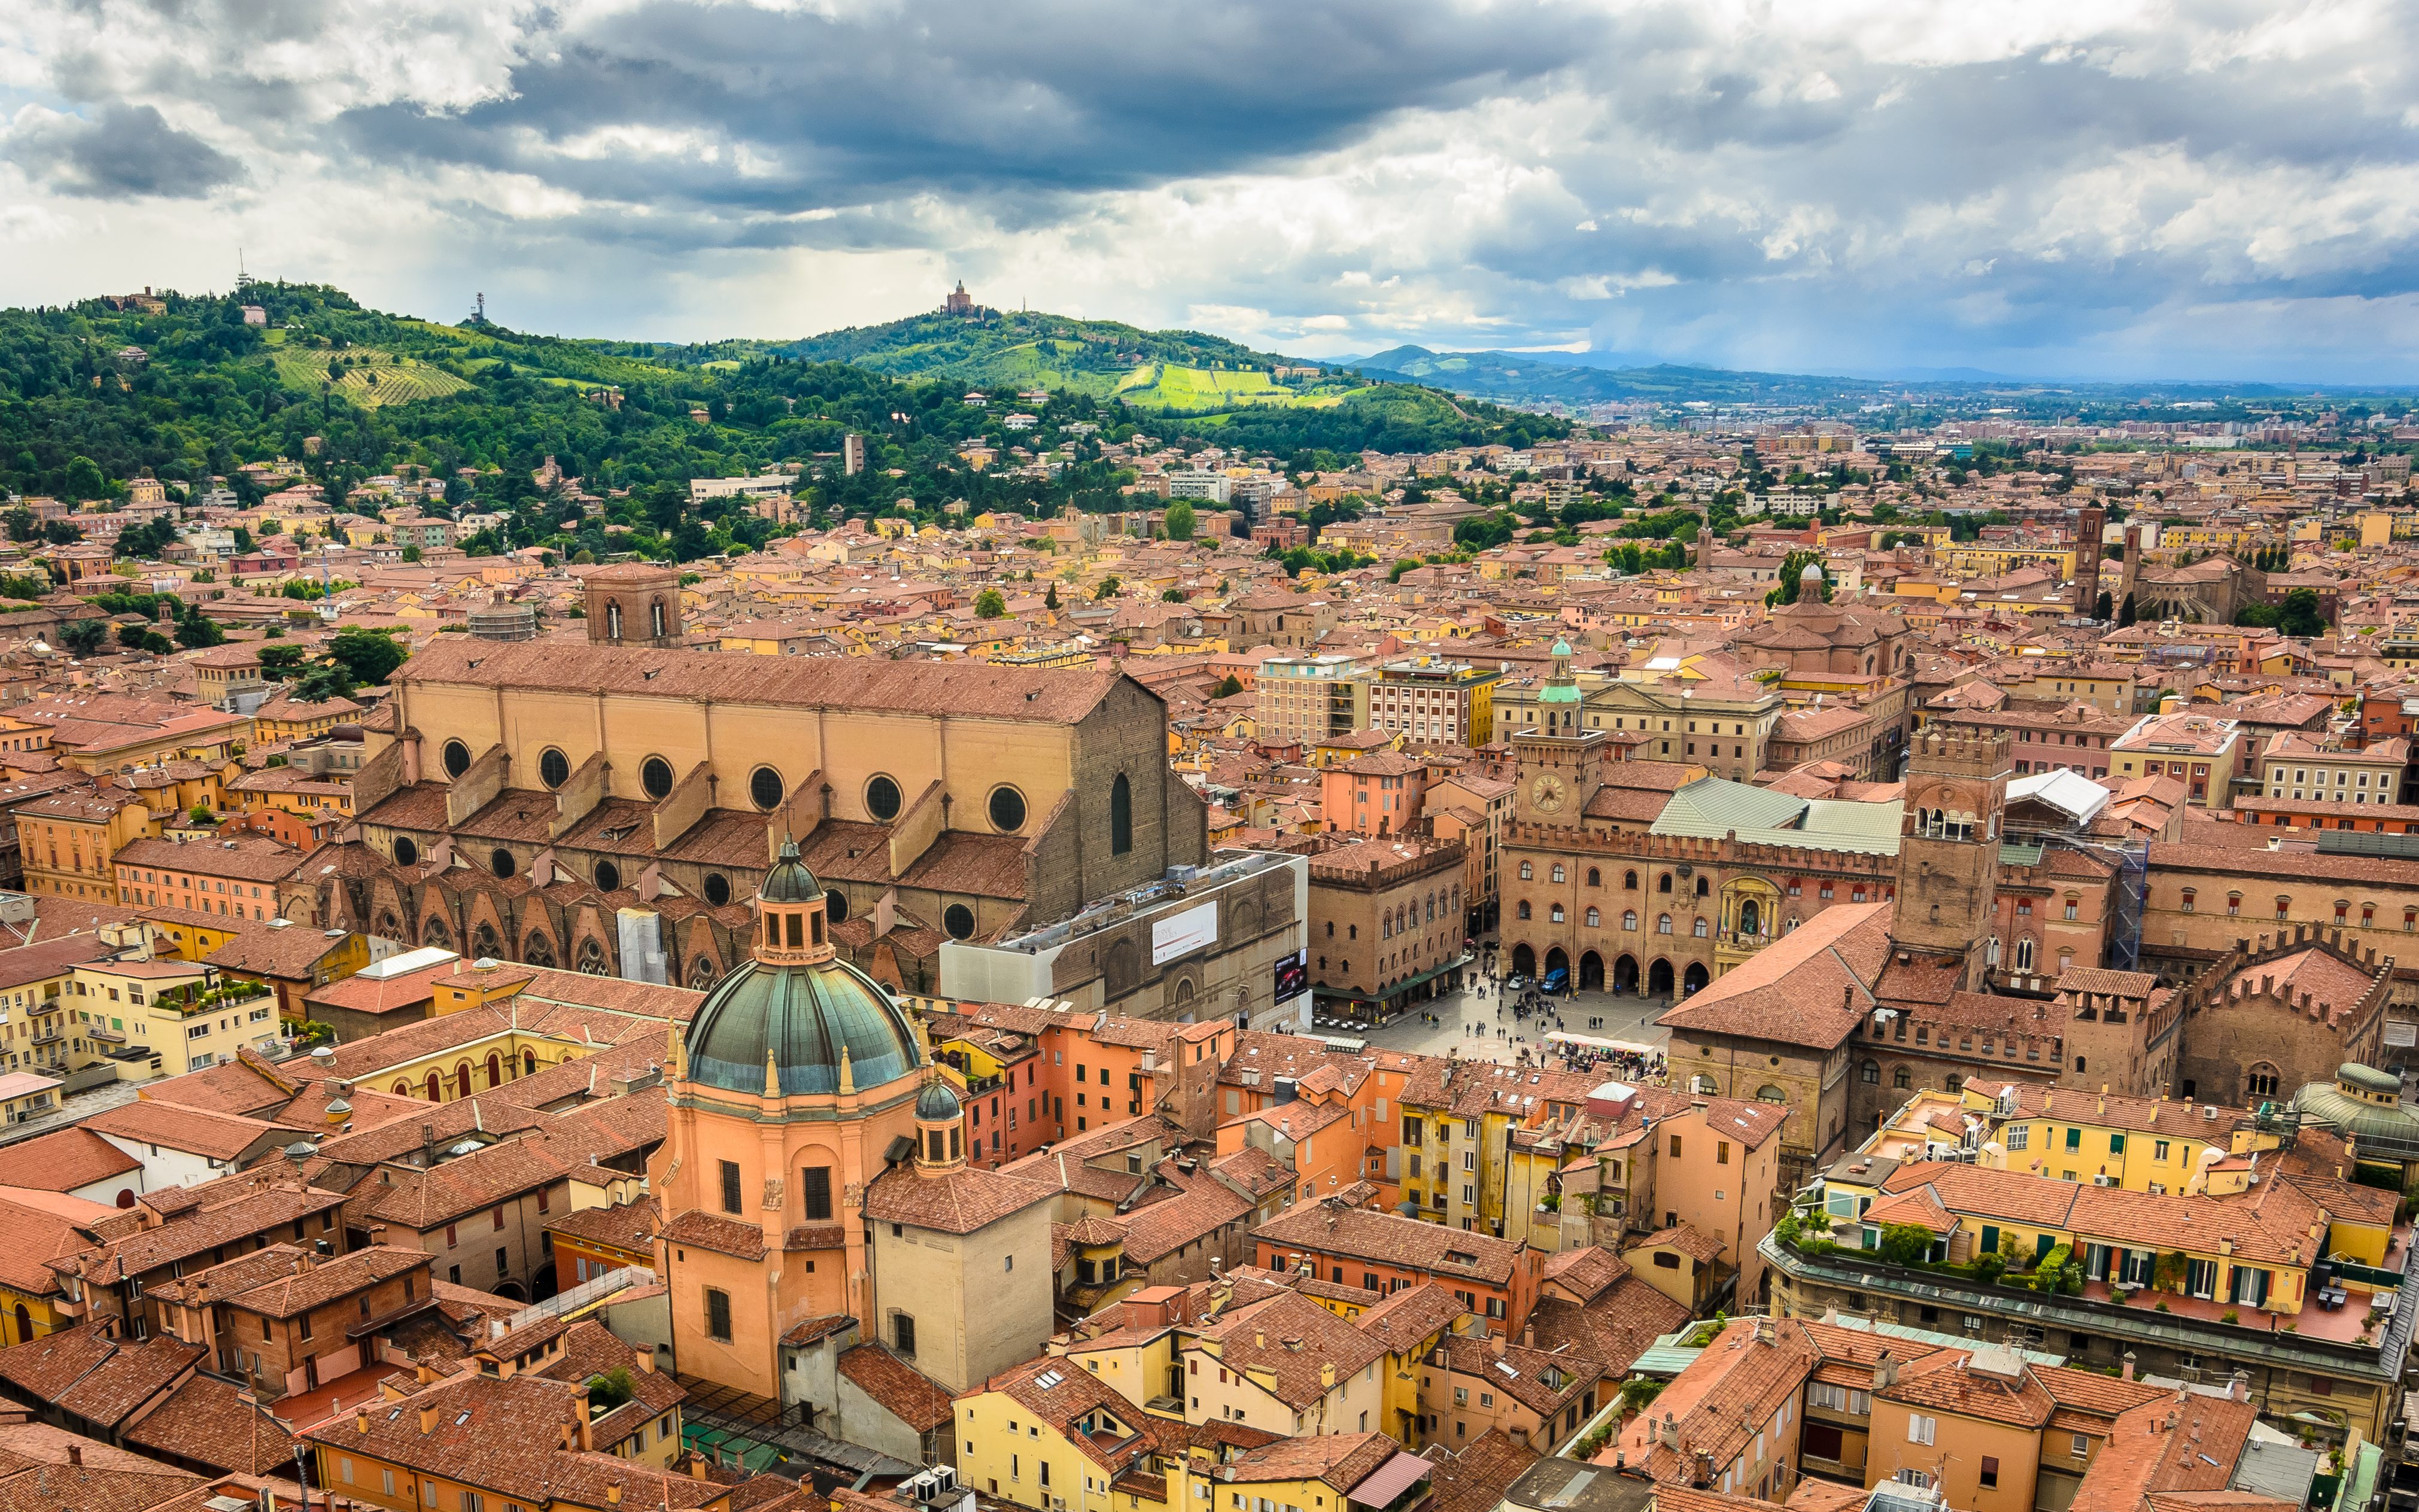
Airbnb Occupancy Rate in Bologna, Italy, Data & Trends 2026
Curious about the performance of short-term rentals in Bologna, Italy? Over the last year, the average occupancy rate was 65% with an ADR (Average Daily Rate) of 129€. Hosts earned on average 2405€ per month.
📩 Send me this report and get it in my inbox every month
90-day occupancy forecast for Bologna so you can update rates and stay ahead of competitors.
Market summary in Bologna
Key metrics to optimize your pricing strategy
Avg. Monthly Revenue
2405€
$2189 USD
YoY Revenue Change
3%
vs. previous year
Occupancy Rate
65%
~20 days/month
Average Daily Rate
129€
$117 USD
Seasonality Index
74%
demand variation
Best Months
May, October
peak season
Worst Months
January, December
low season
Revenue Management in Bologna
Our AI-powered platform automatically optimizes your rates. Maximize your revenue with intelligent dynamic pricing.
What Bologna's occupancy and ADR actually mean
Over the June 2025 to May 2026 analysis period Bologna ran 65% average occupancy, roughly nine points above the national average of about 56% across the 14 Italian cities we track, and the second-highest occupancy in the country behind only Rome (71%). That converts to 235 booked nights a year and an average 2,386€ in monthly revenue at a 128€ ADR.
The nightly rate sits below the national mean of about 182€, but that figure is inflated by alpine resorts such as Cortina d'Ampezzo (562€) and Livigno (262€); among Italian cities Bologna's ADR is mid-table, and the market earns through high, steady occupancy rather than peak pricing. Seasonality of 75% is moderate and below the coastal and alpine markets, confirming a city that books most of the year. Revenue grew 3% year on year, a healthy, stable trajectory and the story here is reliability rather than a boom.
Monthly Airbnb occupancy in Bologna
Average occupancy rate by month in Bologna, compared with the same month a year earlier.
| Month | Occupancy | Prior year |
|---|---|---|
| Jul 2025 | 62.3% | 63.2% |
| Aug 2025 | 62.2% | 61.6% |
| Sep 2025 | 75.8% | 75.5% |
| Oct 2025 | 78.8% | 74.9% |
| Nov 2025 | 62.3% | 58% |
| Dec 2025 | 45.6% | 47.6% |
| Jan 2026 | 45.4% | 45.9% |
| Feb 2026 | 59.1% | 59.4% |
| Mar 2026 | 62.9% | 66.4% |
| Apr 2026 | 73.6% | 74.3% |
| May 2026 | 74.1% | 80.9% |
| Jun 2026 | 70.2% | 71% |
Historical Airbnb occupancy in Bologna (last 12 months)
📌 Historical trends reveal seasonal highs – plan accordingly.
Airbnb occupancy forecast in Bologna (next 90 days)
These figures reflect real-time demand in Bologna, helping you plan and price strategically.
Why people book Airbnbs in Bologna
Bologna's Airbnb demand rests on two pillars that keep it busy where many Italian cities have a single short season: the University of Bologna, the oldest in the Western world (1088) with tens of thousands of students, academics and visiting families; and a year-round trade-fair calendar at BolognaFiere that brings business travellers to events like Cosmoprof, Cersaie and the Children's Book Fair. On top of that sits Bologna's reputation as Italy's food capital, drawing weekend gastronomy tourists to the Quadrilatero market, the porticoes (a UNESCO site) and day trips into Emilia-Romagna's parmesan and balsamic country.
For short-term-rental managers this mix is the opportunity. Demand is broad and midweek-resilient rather than purely leisure-driven, so apartments that work for a fair-going professional (fast Wi-Fi, a desk, self check-in, walking distance to the centre or the station) capture both audiences. Bologna also functions as a transport hub on the Milan-Florence-Rome high-speed line, which feeds steady one- and two-night stopover bookings.
When Airbnb demand peaks in Bologna
Demand peaks in spring and autumn: May and October are the strongest months, when the weather is mild and the events calendar is densest. Autumn stacks Cersaie (21-25 September 2026) and the vintage-car fair Auto e Moto d'Epoca (22-25 October 2026); spring brings Cosmoprof Worldwide (26-29 March 2026), the Bologna Children's Book Fair (13-16 April 2026) and the Portici Festival (4-7 June 2026). February is anchored by Arte Fiera and ART CITY (5-8 February 2026).
The low points are January and December, when fairs pause and student term breaks empty the city. Summer is softer than Italy's coastal markets because Bologna's hot, humid July and August push many visitors toward the Adriatic and the hills, so high-summer pricing should stay realistic. The practical play is to open calendars early for the named trade fairs and price those weeks as premium events rather than counting on a long, flat high season.
Best neighbourhoods for short-term rentals in Bologna
The Centro Storico inside the ring road is the premium, walk-everywhere base around Piazza Maggiore, the Two Towers and the Quadrilatero food market; it earns the highest rates but is also where Bologna's tightest rules bite (see below). The University Quarter (Via Zamboni) is the liveliest area, full of bars and eateries and well suited to younger guests and longer student-linked stays, though noise is an operational risk.
Via Pratello to the west is the affordable trattoria-and-nightlife strip, while Bolognina, just behind Bologna Centrale station, is the multicultural, lower-cost district that converts well for fair-goers and rail stopovers thanks to its station proximity. The Saragozza side, leading up the porticoes to the San Luca sanctuary, suits calmer, scenic stays. For pure event yield, anything within walking distance of the centre or the train station outperforms peripheral addresses.
Short-term rental rules in Bologna
Bologna falls under Italy's national framework: every short-term rental needs the CIN (Codice Identificativo Nazionale) from the Ministry of Tourism's database, plus Emilia-Romagna's regional CIR code, and both must be displayed in every advertisement. Hosts file a SCIA with the comune before letting, report guest data to the Questura via Alloggiati Web, and collect Bologna's tourist tax (up to roughly 5€ per guest per night). Operating without a CIN risks fines of 800€ to 8,000€, with up to 5,000€ for failing to display it; platforms now delist non-compliant listings.
Bologna goes further than most Italian cities in the centre. Planning rules introduced for the Centro Storico use a B3 tourist-accommodation zoning subcategory and impose a minimum apartment size of 50 m², which effectively blocks many smaller historic-core flats from the Airbnb market. These measures are still being contested, so confirm the current Comune di Bologna position before buying or listing a small central unit.
Tools & strategies for Bologna
Revenue Management in Bologna
We help you increase revenue in Bologna with pricing algorithms and active monitoring.
Learn moreDynamic Pricing in Bologna
Our engine auto-adjusts prices based on demand and local events in Bologna.
Learn moreChannel Manager in Bologna
Manage listings on Airbnb, Booking.com and Vrbo in one place across Bologna.
Learn moreCheck your Airbnb in Italy
And around the world
Other cities in Italy
Compare performance across markets – occupancy, ADR and seasonality for other destinations in Italy.
Calculate your revenue potential in Bologna
Discover how much more you could earn by optimizing your properties with ListingOK
Your operation data
How do we achieve these results?
AI Dynamic Pricing
Occupancy Optimization
Market Analysis
24/7 Expert Support
In line with our best results!
Get your full report
Detailed analysis and personalized recommendations
* Calculations based on 30 days/month. Actual results may vary depending on market, season, property type, and implemented strategy.
Suggest a new city in Italy
Frequently asked questions about Airbnb occupancy in Bologna
Bologna averaged 65% occupancy over the June 2025 to May 2026 period, about nine points above the roughly 56% national average across the Italian cities we track and the second-highest in the country behind Rome. That works out to around 235 booked nights a year and an average 2,386€ in monthly revenue at a 128€ ADR, reflecting a market that books steadily rather than in short bursts.
May and October are the strongest months, driven by mild weather and a dense trade-fair calendar: Cersaie (21-25 September 2026), Auto e Moto d'Epoca (22-25 October 2026), Cosmoprof (26-29 March 2026) and the Children's Book Fair (13-16 April 2026). January and December are the quietest, and humid July and August soften as visitors head to the coast, so price the named fairs as premium events.
Yes. You need Italy's national CIN code from the Ministry of Tourism plus Emilia-Romagna's regional CIR, both displayed in every advert, and you must file a SCIA with the comune, report guests via Alloggiati Web and collect the tourist tax. Operating without a CIN risks fines of 800€ to 8,000€. In the Centro Storico, B3 zoning and a 50 m² minimum size also apply.
The Centro Storico around Piazza Maggiore and the Quadrilatero earns the top rates but faces the strictest size and zoning rules. The University Quarter (Via Zamboni) suits younger and longer student stays, Via Pratello offers affordable nightlife, and Bolognina behind the central station converts well for fair-goers and rail stopovers. For event yield, prioritise addresses within walking distance of the centre or the station.