
Airbnb Occupancy Rate in Venice Centre, Italy, Data & Trends 2026
Curious about the performance of short-term rentals in Venice Centre, Italy? Over the last year, the average occupancy rate was 60% with an average nightly price (ADR) of 187€. Hosts earned on average 3258€ per month.

📩 Send me this report and get it in my inbox every month
90-day occupancy forecast for Venice Centre so you can update rates and stay ahead of competitors.
Market summary in Venice Centre
Key metrics to optimize your pricing strategy
Avg. monthly earnings
3258€
$2965 USD
YoY Revenue Change
-3%
vs. previous year
Occupancy Rate
60%
~18 days/month
Average Daily Rate
187€
$170 USD
Seasonality Index
121%
demand variation
Best Months
May, June
peak season
Worst Months
January, December
low season
Revenue Management in Venice Centre
Our AI-powered platform automatically optimizes your rates. Maximize your revenue with intelligent dynamic pricing.
What Venice Centre's occupancy and nightly prices actually mean
Over the analysis window, Venice Centre ran 60% average occupancy across roughly 216 booked nights a year, four points above Italy's 56% national average among the 14 Italian cities tracked. Its standout figure is monetary: a 186 euro average daily rate, among the highest in this dataset, drives average monthly revenue of about 3,207 euros per listing, by far the strongest revenue of any city in this group and a reflection of Venice's unique, supply-constrained pricing power.
The figure that warrants caution is a 9% year-on-year revenue decline, a notable drop that aligns with Venice's tightening regulatory environment and overtourism measures rather than any weakness in underlying demand. The 123% seasonality index, weighted toward spring and autumn peaks, completes the picture: this is a high-rate, high-revenue market where the real risk is regulatory rather than commercial, and where premium pricing in the shoulder windows drives the economics.
Monthly Airbnb occupancy in Venice Centre
Average occupancy rate by month in Venice Centre, compared with the same month a year earlier.
| Month | Occupancy | Prior year |
|---|---|---|
| Oct 2025 | 72.6% | 80.8% |
| Nov 2025 | 45.3% | 53.1% |
| Dec 2025 | 46.6% | 45.2% |
| Jan 2026 | 40.9% | 39.9% |
| Feb 2026 | 53.5% | 58.7% |
| Mar 2026 | 51.7% | 52.1% |
| Apr 2026 | 68.9% | 72.5% |
| May 2026 | 83% | 74.6% |
| Jun 2026 | 68.4% | 66% |
| Jul 2026 | 62.1% | 59% |
| Aug 2026 | 59.6% | 62.6% |
Historical Airbnb occupancy in Venice Centre (last 12 months)
📌 Historical trends reveal seasonal highs – plan accordingly.
Airbnb occupancy forecast in Venice Centre (next 90 days)
These figures reflect real-time demand in Venice Centre, helping you plan and price strategically.
Why people book Airbnbs in Venice Centre
Venice Centre, the historic island core of Venezia, is one of the most concentrated tourism markets on earth, and short-term rental demand here needs little explanation: St Mark's Square and its Basilica, the Doge's Palace, the Rialto Bridge and the Grand Canal draw visitors from every corner of the world, year after year. Layered on top of the constant leisure flow is a powerful cultural calendar, the Venice Carnival in February, the Art and Architecture Biennale, the Venice Film Festival on the Lido in late summer and the Regata Storica, each pulling distinct waves of travellers.
The defining tension in this market is between extraordinary demand and aggressive regulation. Venice has been at the forefront of European efforts to curb overtourism, introducing a day-tripper access fee and tightening rules on tourist lettings, so while the historic centre commands some of Italy's highest rates, it is also one of its most scrutinised and constrained markets for operators.
When Airbnb demand peaks in Venice Centre
Venice Centre carries a 123% seasonality index, but its pattern is unusual: rather than a single summer spike, demand peaks in the shoulder seasons. The strongest months are May and October, when mild weather and the Biennale and cultural calendar draw crowds without summer's heat and congestion; May 2026 reached a remarkable 83% and October 2024 hit 80.7%. Summer itself softens slightly as the heat, crowds and high water deter some visitors. The weakest months are January and December, the cold, damp winter low, with January 2026 down at 41.1%.
This shoulder-peaking profile is a meaningful planning signal: the most valuable weeks are spring and autumn, not high summer. February's Carnival creates a sharp, isolated demand spike worth pricing for, and the September Film Festival lifts late summer. Operators should treat May and October as the premium windows, price the Carnival and Biennale openings aggressively, and expect a genuinely quiet midwinter.
Best neighbourhoods for short-term rentals in Venice Centre
Venice's six historic sestieri each carry a distinct rental profile. San Marco, wrapped around the basilica and the piazza, is the most central and highest-rate district, prized for prestige and proximity to the headline sights but the most expensive and tourist-saturated. San Polo and Santa Croce, around the Rialto market and bridge, sit at the commercial heart and offer strong footfall and central convenience for guests who want to be in the thick of things.
Dorsoduro, home to the Accademia and Peggy Guggenheim galleries and the lively Campo Santa Margherita, blends culture with a more local, student-influenced atmosphere and converts well for cultural travellers. Cannaregio, the large northern sestiere including the historic Jewish Ghetto, offers a quieter, more residential and authentic feel, often at better value, while Castello, the largest sestiere and home to the Biennale's Arsenale and Giardini, ranges from busy near San Marco to genuinely local further east. Across all of them, regulatory compliance now matters as much as location.
Short-term rental rules in Venice Centre
Short-term rentals in Venice fall under Italy's national framework plus stringent local rules. Since 1 January 2025, every tourist accommodation, including short-let apartments, must obtain a CIN (Codice Identificativo Nazionale) from the Ministry of Tourism, displayed in every advertisement and at the property, with safety equipment such as fire extinguishers and gas and carbon-monoxide detectors required; operating without a CIN risks substantial fines and delisting. A regional CIR identifier and guest-data reporting to the Questura also apply.
Venice goes further than most Italian cities: the comune has introduced measures to curb tourist pressure, including a day-tripper access fee on peak days and moves to cap or limit tourist lettings in the historic centre, alongside in-person check-in requirements. Because Venice's rules are among the strictest and fastest-changing in Italy, anyone operating in the historic centre should verify current CIN, CIR, registration and any letting-cap requirements with the Comune di Venezia and regional authorities before listing.
Tools & strategies for Venice Centre
Revenue Management in Venice Centre
We help you increase revenue in Venice Centre with pricing algorithms and active monitoring.
Learn moreDynamic Pricing in Venice Centre
Our engine auto-adjusts prices based on demand and local events in Venice Centre.
Learn moreChannel Manager in Venice Centre
Manage listings on Airbnb, Booking.com and Vrbo in one place across Venice Centre.
Learn moreCheck your Airbnb in Italy
And around the world
Other cities in Italy
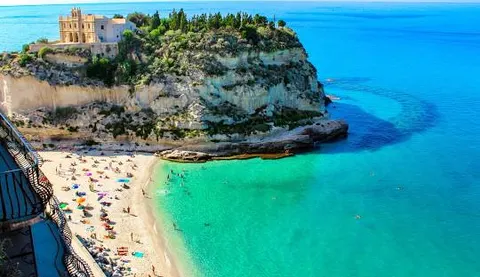
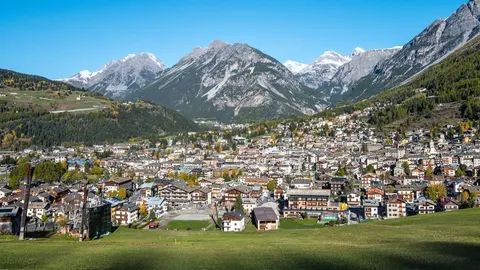
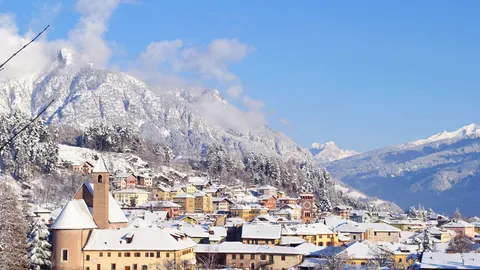
Compare performance across markets – occupancy, nightly prices and seasonality for other destinations in Italy.







Calculate your earnings potential in Venice Centre
Discover how much more you could earn by optimizing your listings with ListingOK
Your listings
How do we achieve these results?
AI Dynamic Pricing
Occupancy Optimization
Market Analysis
24/7 Expert Support
In line with our best results!
Get your full report
Detailed analysis and personalized recommendations
* Calculations based on 30 days/month. Actual results may vary depending on market, season, property type, and implemented strategy.
Suggest a new city in Italy
Frequently asked questions about Airbnb occupancy in Venice Centre
Venice Centre averaged about 60% occupancy over the analysis period, roughly 216 booked nights a year, four points above Italy's 56% national average among the 14 Italian cities ListingOK tracks. More striking is its revenue: a 186 euro average daily rate drives roughly 3,207 euros average monthly revenue per listing, the highest in this group.
Unusually, the peaks are in spring and autumn, not high summer. May and October are the strongest months, with May 2026 reaching 83% and October 2024 at 80.7%, helped by mild weather and the Biennale. January and December are the weakest. The February Carnival creates a sharp spike worth pricing for, and the September Film Festival lifts late summer.
Yes, and Venice is among Italy's strictest markets. Since January 2025 every tourist let needs a CIN national code displayed in all listings, plus safety equipment, a regional CIR identifier and guest reporting to the Questura. Venice also limits tourist pressure with measures like a day-tripper fee. Verify current CIN and any letting-cap rules with the Comune di Venezia before listing.
San Marco commands the highest rates around the basilica and piazza but is the most saturated; San Polo and Santa Croce sit at the central Rialto commercial heart. Dorsoduro blends galleries with a livelier local feel; Cannaregio offers a quieter, better-value residential stay near the Ghetto; Castello ranges from busy to genuinely local. Regulatory compliance now matters as much as the sestiere.