
Airbnb Occupancy Rate in Nerja, Spain, Data & Trends 2026
Curious about the performance of short-term rentals in Nerja, Spain? Over the last year, the average occupancy rate was 67% with an average nightly price (ADR) of 132€. Hosts earned on average 2325€ per month.

📩 Send me this report and get it in my inbox every month
90-day occupancy forecast for Nerja so you can update rates and stay ahead of competitors.
Market summary in Nerja
Key metrics to optimize your pricing strategy
Avg. monthly earnings
2325€
$2116 USD
YoY Revenue Change
-1%
vs. previous year
Occupancy Rate
67%
~20 days/month
Average Daily Rate
132€
$120 USD
Seasonality Index
134%
demand variation
Best Months
August, July
peak season
Worst Months
December, January
low season
Revenue Management in Nerja
Our AI-powered platform automatically optimizes your rates. Maximize your revenue with intelligent dynamic pricing.
What Nerja's occupancy and nightly prices actually mean
Over the analysis period August 2025 to July 2026, Nerja ran 67% average occupancy against a Spanish average of about 62% across the 34 Spanish cities we track, which places it comfortably in the upper half without making it an outlier. That converts to roughly 242 booked nights a year.
Its ADR of 134 sits exactly on the Spanish average, and average monthly revenue of 2,363 is marginally above the 2,341 national figure. The pattern is worth understanding: Nerja does not earn through premium pricing, it earns through length of season. A market with average rates and above-average occupancy is one where the return comes from filling shoulder months rather than from pushing August higher. Revenue was down 1% year on year, essentially flat, which in a period when several Spanish coastal markets softened reads as stability rather than stall.
Monthly Airbnb occupancy in Nerja
Average occupancy rate by month in Nerja, compared with the same month a year earlier.
| Month | Occupancy | Prior year |
|---|---|---|
| Sep 2025 | 72.7% | 76.3% |
| Oct 2025 | 69.1% | 72.6% |
| Nov 2025 | 50.4% | 53.6% |
| Dec 2025 | 52.8% | 57.4% |
| Jan 2026 | 60.2% | 62.8% |
| Feb 2026 | 74.8% | 77.3% |
| Mar 2026 | 63.8% | 66.4% |
| Apr 2026 | 63.1% | 69% |
| May 2026 | 66.7% | 63.3% |
| Jun 2026 | 72.6% | 76.3% |
| Jul 2026 | 81.6% | 84.5% |
| Aug 2026 | 83.5% | 85.8% |
Historical Airbnb occupancy in Nerja (last 12 months)
📌 Historical trends reveal seasonal highs – plan accordingly.
Airbnb occupancy forecast in Nerja (next 90 days)
These figures reflect real-time demand in Nerja, helping you plan and price strategically.
Why people book Airbnbs in Nerja
Nerja sits at the eastern end of Malaga province where the Costa del Sol meets the Axarquia, and its short-term-rental demand rests on a compact beach town that never industrialised the way the resorts west of Malaga did. The Balcon de Europa promenade, the coves at Burriana and Maro, and the Cuevas de Nerja draw a steady leisure crowd, while the Sierra de Almijara behind the town adds walking and gorge traffic in the shoulder months.
The guest mix leans heavily British and Northern European, with a large repeat-visitor base and a meaningful winter-resident segment that books longer stays. For managers this produces a market that behaves less like a pure July and August resort and more like a long-season one: demand builds in spring, holds through autumn, and only genuinely thins in late November and December. Supply is dominated by apartments and townhouses within walking distance of the beaches rather than by large complexes.
When Airbnb demand peaks in Nerja
Nerja carries a seasonality index of 126, moderate for a Spanish coastal market and well below the extremes seen in the Balearics. August and July are the strongest months, as they are almost everywhere on the Andalusian coast, but the shoulder performance is what distinguishes Nerja: May, June, September and October all trade well on walking, cave and beach demand from Northern European visitors avoiding the peak heat.
The soft months are December and November. That trough is shallower than in most Spanish beach towns because Nerja retains a resident winter population and attracts long-stay guests escaping Northern European winters, which puts a floor under occupancy once the day-trip market disappears. Managers should treat the November to February window as a length-of-stay opportunity rather than a period in which to discount nightly rates aggressively.
Best neighbourhoods for short-term rentals in Nerja
The centre around the Balcon de Europa commands the strongest rates and the steadiest occupancy, because guests come to walk to the promenade, the old town and the restaurants without needing a car. Properties within a few streets of the Balcon, and those on the slope down to Calahonda and Carabeillo beaches, sell on that walkability.
Burriana is the other premium pocket: the town's main beach, with the chiringuito trade and the longest usable stretch of sand, and it supports higher summer rates for apartments with sea views. West of the centre, Torrecilla offers a slightly gentler entry price with the same beach access. Further out, Maro is a quieter village setting near the caves and the Acantilados natural park, better suited to guests who want calm and will drive, while the hillside urbanisations trade sea views against a walk back into town.
Tools & strategies for Nerja
Revenue Management in Nerja
We help you increase revenue in Nerja with pricing algorithms and active monitoring.
Learn moreDynamic Pricing in Nerja
Our engine auto-adjusts prices based on demand and local events in Nerja.
Learn moreChannel Manager in Nerja
Manage listings on Airbnb, Booking.com and Vrbo in one place across Nerja.
Learn moreCheck your Airbnb in Spain
And around the world
Other cities in Spain
Compare performance across markets – occupancy, nightly prices and seasonality for other destinations in Spain.

Madrid
72%
Barcelona
73%
Valencia
71%
Seville
67%
Malaga
75%
Murcia
63%
Palma
68%
Las Palmas de Gran Canaria
68%
Alicante
70%
Bilbao
64%
Córdoba
52%
Vigo
58%
A Coruña
60%
Granada
59%
Jerez de la Frontera
48%
San Sebastián
62%
Santiago de Compostela
56%
Lugo
49%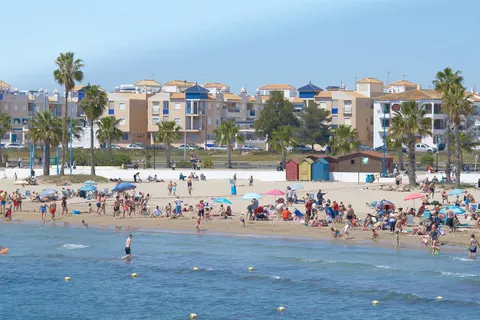
Torrevieja
62%
Estepona
63%
Benidorm
63%
Torremolinos
75%
Vilanova i la Geltrú
64%
Cuenca
53%
Dénia
58%
Los Realejos
67%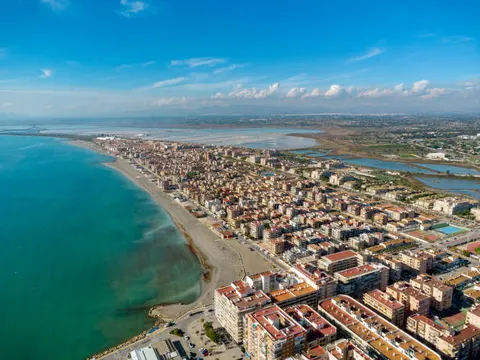
Santa Pola
70%
Inca
60%
Altea
61%
Santa Úrsula
67%
Capdepera
56%
Arico
65%Ribamontán al Mar
48%Calculate your earnings potential in Nerja
Discover how much more you could earn by optimizing your listings with ListingOK
Your listings
How do we achieve these results?
AI Dynamic Pricing
Occupancy Optimization
Market Analysis
24/7 Expert Support
In line with our best results!
Get your full report
Detailed analysis and personalized recommendations
* Calculations based on 30 days/month. Actual results may vary depending on market, season, property type, and implemented strategy.
Suggest a new city in Spain
Frequently asked questions about Airbnb occupancy in Nerja
Over the August 2025 to July 2026 analysis period, Nerja averaged 67% occupancy, equal to about 242 booked nights a year. That is roughly five points above the Spanish average of about 62% across the 34 Spanish cities we track, and it reflects a long season rather than an unusually strong summer.
Average monthly revenue per listing was 2,363 over the analysis period, slightly above the Spanish average of 2,341. The ADR of 134 is exactly the national average, so the earnings come from filling more nights rather than from charging more per night.
August and July are the peak months, but Nerja's real advantage is its shoulder season. May, June, September and October all trade well with Northern European visitors avoiding the peak heat. December and November are the softest months, though the winter trough is shallower here than in most Spanish beach towns.
The centre around the Balcon de Europa commands the strongest rates because guests can walk everywhere without a car. Burriana beach is the other premium pocket and supports higher summer rates for sea-view apartments. Torrecilla offers a gentler entry price with similar beach access, while Maro suits guests who want quiet and will drive.