
Airbnb Occupancy Rate in Vilanova i la Geltrú, Spain, Data & Trends 2026
Curious about the performance of short-term rentals in Vilanova i la Geltrú, Spain? Over the last year, the average occupancy rate was 64% with an average nightly price (ADR) of 140€. Hosts earned on average 2442€ per month.

📩 Send me this report and get it in my inbox every month
90-day occupancy forecast for Vilanova i la Geltrú so you can update rates and stay ahead of competitors.
Market summary in Vilanova i la Geltrú
Key metrics to optimize your pricing strategy
Avg. monthly earnings
2442€
$2222 USD
YoY Revenue Change
5%
vs. previous year
Occupancy Rate
64%
~19 days/month
Average Daily Rate
140€
$127 USD
Seasonality Index
122%
demand variation
Best Months
August, July
peak season
Worst Months
January, February
low season
Revenue Management in Vilanova i la Geltrú
Our AI-powered platform automatically optimizes your rates. Maximize your revenue with intelligent dynamic pricing.
What Vilanova i la Geltrú's occupancy and nightly prices actually mean
Over the analysis period August 2025 to July 2026, Vilanova i la Geltru ran 63% average occupancy, marginally above the Spanish average of about 62% across the 34 Spanish cities we track, equal to roughly 227 booked nights a year. Its ADR of 140 is close to the 134 national average, and average monthly revenue of 2,391 is a little above the 2,341 Spanish figure.
On the headline numbers this looks like an average Spanish market, but the seasonality index of 113 is what makes it interesting. Vilanova reaches those results without a dominant peak, meaning the revenue is spread across the year rather than concentrated into eight weeks. For an operator that is a materially different business: steadier cash flow, less exposure to a single bad summer, and more room to build repeat and longer-stay bookings. Revenue rose 3% year on year, consistent with a stable market rather than a volatile one.
Monthly Airbnb occupancy in Vilanova i la Geltrú
Average occupancy rate by month in Vilanova i la Geltrú, compared with the same month a year earlier.
| Month | Occupancy | Prior year |
|---|---|---|
| Sep 2025 | 60.7% | 68.9% |
| Oct 2025 | 68.5% | 61% |
| Nov 2025 | 58.6% | 55.4% |
| Dec 2025 | 68.3% | 64.9% |
| Jan 2026 | 55.2% | 57.8% |
| Feb 2026 | 65.9% | 69.1% |
| Mar 2026 | 68% | 58.8% |
| Apr 2026 | 69.7% | 78.5% |
| May 2026 | 75.5% | 75% |
| Jun 2026 | 68.1% | 76.8% |
| Jul 2026 | 81.4% | 78.6% |
| Aug 2026 | 86% | 79.9% |
Historical Airbnb occupancy in Vilanova i la Geltrú (last 12 months)
📌 Historical trends reveal seasonal highs – plan accordingly.
Airbnb occupancy forecast in Vilanova i la Geltrú (next 90 days)
These figures reflect real-time demand in Vilanova i la Geltrú, helping you plan and price strategically.
Why people book Airbnbs in Vilanova i la Geltrú
Vilanova i la Geltru is the capital of the Garraf, a working coastal city of around 68,000 people some 45 kilometres south-west of Barcelona with a direct commuter rail line into the centre. That combination is the whole basis of its short-term-rental market: it offers a genuine Catalan town with a fishing port, a long urban beach and its own economy, at a fraction of Barcelona's nightly rates and fifty minutes from its centre by train.
Demand splits three ways. There is domestic beach traffic from Barcelona and inland Catalonia in summer, an international leisure segment using the city as a cheaper base for the region, and a steady year-round layer of business, family and event visitors that most Spanish coastal towns simply lack. The February carnival is among the largest in Catalonia and fills the city outright. Supply is mostly apartments, in the centre and along the seafront, rather than villa stock.
When Airbnb demand peaks in Vilanova i la Geltrú
Vilanova i la Geltru carries a seasonality index of 113, the flattest profile of the Spanish coastal markets in this group and unusually even for a beach destination. July and August are still the strongest months, but the gap between peak and trough is far narrower than in the Balearics or on the Cantabrian coast, because the city keeps functioning when the beach season ends.
January and November are the softest months, and even they are workable rather than dead. February is worth planning around specifically: the carnival is a major regional event and produces a genuine winter spike that most Spanish coastal towns have no equivalent of. Spring and autumn hold up on weekend traffic from Barcelona and on the cycling and walking demand of the Garraf massif. This is a calendar an operator can fill for most of the year, which is rare on this coast.
Best neighbourhoods for short-term rentals in Vilanova i la Geltrú
The seafront is the premium stretch. Ribes Roges, at the western end, is the most desirable beachfront address, with the promenade, the sailing club and the widest sand, and apartments with sea views there command the strongest rates. Moving east along the front towards Sant Gervasi, prices ease while beach access stays effectively identical.
The historic centre around the Rambla Principal and the Plaça de la Vila is the other strong pocket, and it is the one that works best out of season, since guests there are buying restaurants, shops and the station rather than sand. The port area between the two, with its fish market and seafood restaurants, has a character of its own and lets well to visitors who want the working town. Further inland the residential districts are cheaper to buy into but noticeably harder to keep occupied, because the walk to either the beach or the centre becomes the deciding factor for guests.
Tools & strategies for Vilanova i la Geltrú
Revenue Management in Vilanova i la Geltrú
We help you increase revenue in Vilanova i la Geltrú with pricing algorithms and active monitoring.
Learn moreDynamic Pricing in Vilanova i la Geltrú
Our engine auto-adjusts prices based on demand and local events in Vilanova i la Geltrú.
Learn moreChannel Manager in Vilanova i la Geltrú
Manage listings on Airbnb, Booking.com and Vrbo in one place across Vilanova i la Geltrú.
Learn moreCheck your Airbnb in Spain
And around the world
Other cities in Spain
Compare performance across markets – occupancy, nightly prices and seasonality for other destinations in Spain.

Madrid
72%
Barcelona
73%
Valencia
71%
Seville
67%
Malaga
75%
Murcia
63%
Palma
68%
Las Palmas de Gran Canaria
68%
Alicante
70%
Bilbao
64%
Córdoba
52%
Vigo
58%
A Coruña
60%
Granada
59%
Jerez de la Frontera
48%
San Sebastián
62%
Santiago de Compostela
56%
Lugo
49%
Torrevieja
62%
Estepona
63%
Benidorm
63%
Torremolinos
75%
Cuenca
53%
Dénia
58%
Los Realejos
67%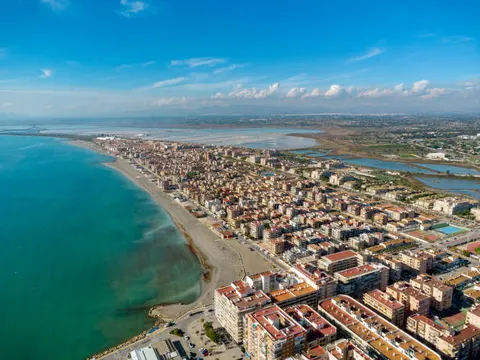
Santa Pola
70%
Inca
60%
Altea
61%
Nerja
67%
Santa Úrsula
67%
Capdepera
56%
Arico
65%Ribamontán al Mar
48%Calculate your earnings potential in Vilanova i la Geltrú
Discover how much more you could earn by optimizing your listings with ListingOK
Your listings
How do we achieve these results?
AI Dynamic Pricing
Occupancy Optimization
Market Analysis
24/7 Expert Support
In line with our best results!
Get your full report
Detailed analysis and personalized recommendations
* Calculations based on 30 days/month. Actual results may vary depending on market, season, property type, and implemented strategy.
Suggest a new city in Spain
Frequently asked questions about Airbnb occupancy in Vilanova i la Geltrú
Over the August 2025 to July 2026 analysis period, occupancy averaged 63%, about 227 booked nights a year, marginally above the Spanish average of roughly 62%. What distinguishes it is not the level but the spread: a seasonality index of 113 means those nights are distributed across the year rather than concentrated in summer.
Average monthly revenue per listing was 2,391, a little above the Spanish average of 2,341, on an ADR of 140 against a 134 national average. The figures are close to typical for Spain, but they are earned far more evenly through the year than in most coastal markets.
July and August are the strongest months, but the peak-to-trough gap is unusually narrow. January and November are softest and still workable. February deserves specific planning, as the carnival is one of the largest in Catalonia and produces a genuine winter spike that most Spanish coastal towns lack.
Ribes Roges at the western end of the seafront is the premium address and commands the strongest rates for sea-view apartments. The historic centre around the Rambla Principal performs best out of season, since guests there are buying restaurants, shops and the station rather than the beach.