
Airbnb Occupancy Rate in Kansas City, United States, Data & Trends 2026
Curious about the performance of short-term rentals in Kansas City, United States? Over the last year, the average occupancy rate was 61% with an average nightly price (ADR) of 169€. Hosts earned on average 2839€ per month.

📩 Send me this report and get it in my inbox every month
90-day occupancy forecast for Kansas City so you can update rates and stay ahead of competitors.
Market summary in Kansas City
Key metrics to optimize your pricing strategy
Avg. monthly earnings
2839€
$2583 USD
YoY Revenue Change
10%
vs. previous year
Occupancy Rate
61%
~18 days/month
Average Daily Rate
169€
$154 USD
Seasonality Index
57%
demand variation
Best Months
June, July
peak season
Worst Months
January, February
low season
Revenue Management in Kansas City
Our AI-powered platform automatically optimizes your rates. Maximize your revenue with intelligent dynamic pricing.
What Kansas City's occupancy and nightly prices actually mean
Over the analysis period June 2025 to May 2026, Kansas City averaged 50% occupancy at an ADR of about $105 (116 euros), producing roughly $1,494 (1,643 euros) in average monthly revenue per listing. That occupancy sits roughly 10 points below the United States city average of about 60% in the same dataset, and the ADR is well under the national average near 202 euros, so Kansas City ranks near the bottom (37th of 39 cities) on occupancy and is firmly a value market.
Revenue was down 9% year over year, and seasonality is pronounced at 46%, meaning the gap between peak and trough months is wide. The practical read: this is a thin-margin, event-led market. Profit comes from capturing the May-June peak and Chiefs weekends aggressively, controlling costs, and avoiding the assumption that steady year-round bookings will carry a listing.
Monthly Airbnb occupancy in Kansas City
Average occupancy rate by month in Kansas City, compared with the same month a year earlier.
| Month | Occupancy | Prior year |
|---|---|---|
| Oct 2025 | 69.5% | 68.7% |
| Nov 2025 | 64.7% | 67.3% |
| Dec 2025 | 63.5% | 63.2% |
| Jan 2026 | 55.6% | 57.9% |
| Feb 2026 | 65.2% | 64.1% |
| Mar 2026 | 70.7% | 70.4% |
| Apr 2026 | 65.4% | 66.1% |
| May 2026 | 66.8% | 71.1% |
| Jun 2026 | 61.7% | 75.7% |
| Jul 2026 | 57.5% | 75.2% |
| Aug 2026 | 61.9% | 67.3% |
| Sep 2026 | 67.2% | 67.1% |
Historical Airbnb occupancy in Kansas City (last 12 months)
📌 Historical trends reveal seasonal highs – plan accordingly.
Airbnb occupancy forecast in Kansas City (next 90 days)
These figures reflect real-time demand in Kansas City, helping you plan and price strategically.
Why people book Airbnbs in Kansas City
Kansas City, Missouri, draws short-term-rental demand from a mix of business travel, sports tourism and culture. The city is home to the NFL's Chiefs at Arrowhead Stadium and the MLB's Royals at Kauffman Stadium, and game weekends reliably fill nearby listings. Conventions and corporate visits cluster downtown around the T-Mobile Center and the Power & Light District, while the Country Club Plaza, the Nelson-Atkins Museum of Art and the National WWI Museum and Memorial pull in leisure guests.
Known as the 'City of Fountains' and a capital of Kansas City-style barbecue and jazz, the metro attracts road-trip and weekend visitors from across the Midwest. With 124 active listings tracked and 181 booked nights per year, this is a mid-sized, value-priced market rather than a high-ADR coastal destination, so occupancy and pricing reward operators who target the event calendar carefully.
When Airbnb demand peaks in Kansas City
Demand peaks in late spring and early summer: the strongest months in the data are May and June, helped by warm weather and a dense festival season. June brings Juneteenth celebrations in the 18th & Vine Jazz District (largest events around 19-21 June 2026), the Heart of America Shakespeare Festival (16 June-5 July 2026) and the nearby Great Lenexa BBQ Battle (26-27 June). Barbecue and music festivals run through the warm months, and in summer 2026 Kansas City also hosts FIFA World Cup matches at Arrowhead, an exceptional demand spike.
The low season is winter. January and February are the weakest months, when temperatures sit around freezing (January averages near 31°F) and leisure travel thins out. Operators should hold firm summer rates and lean on Chiefs home games (autumn-winter) to defend occupancy through the colder, quieter stretch.
Best neighbourhoods for short-term rentals in Kansas City
Downtown and the Power & Light District are the obvious base for event-driven stays: nine blocks of bars, restaurants and concerts, walkable to the T-Mobile Center and the free KC Streetcar. The adjacent Crossroads Arts District suits guests who want galleries, First Fridays and independent dining, while the River Market, a 150-year-old farmers-market neighbourhood on the streetcar line, works well for walkable, food-focused trips.
The Country Club Plaza, a Spanish-Revival shopping district with fountains, and Westport, the historic nightlife strip in Midtown, draw a more upscale and social crowd respectively. For short-term rental, downtown and Midtown commercial corridors matter most because Kansas City restricts non-resident rentals to commercially zoned areas, which steers investor listings toward these districts rather than quiet residential streets.
Short-term rental rules in Kansas City
Kansas City, Missouri requires every operator offering stays under 30 consecutive nights to register with the city's Neighborhood Services Department before listing on Airbnb or VRBO. Registration runs through the CompassKC online portal, carries a roughly $200 application fee, and the approved registration number must appear in the listing. Operating without it can bring fines of $200 to $1,000, with each day treated as a separate violation.
Under Ordinance 230268 (passed June 2023) rentals are split into two categories. A 'resident' rental must be the host's primary residence, occupied at least 270 days a year. A 'non-resident' rental, where no one lives on-site that long, is prohibited in all residentially zoned areas and may only operate in commercial zones, subject to density limits. Investors buying purely for short-term rental should confirm commercial zoning before committing.
Tools & strategies for Kansas City
Revenue Management in Kansas City
We help you increase revenue in Kansas City with pricing algorithms and active monitoring.
Learn moreDynamic Pricing in Kansas City
Our engine auto-adjusts prices based on demand and local events in Kansas City.
Learn moreChannel Manager in Kansas City
Manage listings on Airbnb, Booking.com and Vrbo in one place across Kansas City.
Learn moreCheck your Airbnb in United States
And around the world
Other cities in United States
Compare performance across markets – occupancy, nightly prices and seasonality for other destinations in United States.
New York
76%
Los Angeles
75%
Chicago
65%
Houston
56%
Phoenix
63%
Philadelphia
60%
San Antonio
56%
San Diego
66%
Dallas
60%
Austin
58%
Indianapolis
57%
San Francisco
74%
Seattle
64%
Nashville
58%
Denver
68%
Washington
65%
Las Vegas
59%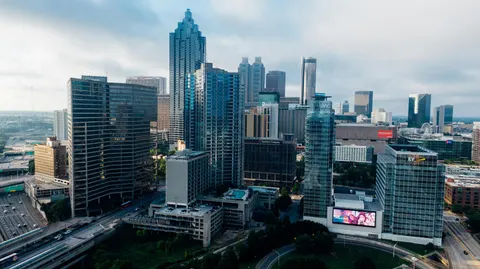
Atlanta
55%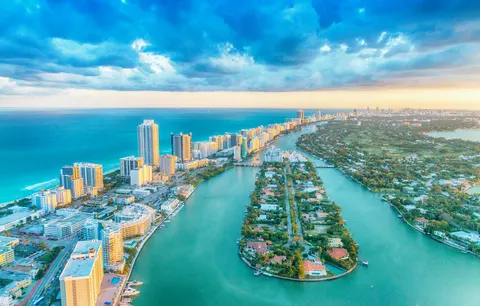
Miami
61%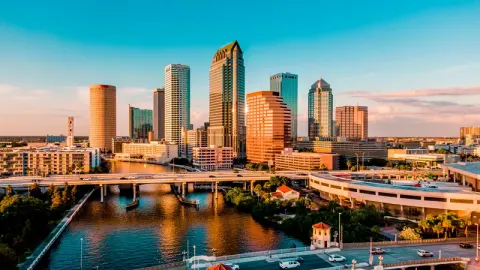
Tampa
60%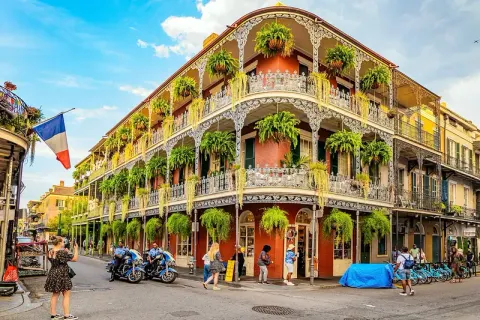
New Orleans
55%
Honolulu
74%
Orlando
61%
Pittsburgh
58%
Scottsdale
63%
Tacoma
62%
Fayetteville
50%
Salt Lake City
66%
Athens
46%
Davenport
61%
Santa Fe
62%
Miami Beach
61%
Daytona Beach
54%
Idaho Falls
54%
Galveston
44%
Venice
75%
South Lake Tahoe
46%
Durango
49%
Panama City Beach
56%
Santa Rosa Beach
53%
Lahaina
64%
Little River
52%
Alamosa
53%Kill Devil Hills
52%Dripping Springs
58%
Carterville
55%
Big Bear Lake
37%
Rockaway Beach
54%
The Sea Ranch
53%
Springville
48%
Anna Maria
61%Calculate your earnings potential in Kansas City
Discover how much more you could earn by optimizing your listings with ListingOK
Your listings
How do we achieve these results?
AI Dynamic Pricing
Occupancy Optimization
Market Analysis
24/7 Expert Support
In line with our best results!
Get your full report
Detailed analysis and personalized recommendations
* Calculations based on 30 days/month. Actual results may vary depending on market, season, property type, and implemented strategy.
Suggest a new city in United States
Frequently asked questions about Airbnb occupancy in Kansas City
Across the June 2025 to May 2026 analysis period, Kansas City listings averaged about 50% occupancy, or roughly 181 booked nights a year. That is around 10 points below the United States city average of about 60% in the same dataset, placing Kansas City among the lower-occupancy, value-priced markets rather than the high-demand coastal cities.
Late spring and early summer are strongest, with May and June the peak months thanks to warm weather, Juneteenth, the Shakespeare Festival and barbecue events. Chiefs home games defend autumn and winter occupancy. January and February are weakest, with near-freezing temperatures and thin leisure demand, so push rates hardest in the May-June window and around major events.
Yes. Every stay under 30 nights requires registration with the Neighborhood Services Department via the CompassKC portal, a roughly $200 fee, and the registration number displayed in your listing. Rentals are split into resident (primary home, 270+ days) and non-resident categories, the latter banned in residential zones. Fines of $200 to $1,000 per day apply for operating unregistered.
Downtown and the Power & Light District lead for event-driven stays, with walkable nightlife and streetcar access. The Crossroads Arts District and River Market suit culture and food travellers, while the Country Club Plaza and Westport draw upscale and social crowds. Because non-resident rentals are limited to commercial zones, downtown and Midtown corridors are the practical focus for investors.