
Airbnb Occupancy Rate in Seattle, United States, Data & Trends 2026
Curious about the performance of short-term rentals in Seattle, United States? Over the last year, the average occupancy rate was 64% with an average nightly price (ADR) of 156€. Hosts earned on average 2812€ per month.

📩 Send me this report and get it in my inbox every month
90-day occupancy forecast for Seattle so you can update rates and stay ahead of competitors.
Market summary in Seattle
Key metrics to optimize your pricing strategy
Avg. monthly earnings
2812€
$2559 USD
YoY Revenue Change
-5%
vs. previous year
Occupancy Rate
64%
~19 days/month
Average Daily Rate
156€
$142 USD
Seasonality Index
99%
demand variation
Best Months
July, June
peak season
Worst Months
February, January
low season
Revenue Management in Seattle
Our AI-powered platform automatically optimizes your rates. Maximize your revenue with intelligent dynamic pricing.
What Seattle's occupancy and nightly prices actually mean
Over the June 2025 to May 2026 analysis period, Seattle averaged 66% occupancy, running roughly six points above the 60% US average across the cities we track and ranking 7th of 39 markets on occupancy. That reflects the steady corporate demand described above. The annual figure works out to about 237 booked nights per listing.
Average daily rate is the trade-off: at €149 (about $135), Seattle sits well below the national ADR average near €202, ranking only 27th of 39 on price. The result is a solid but not premium €2,771 (about $2,519) in average monthly revenue. Note the -8% year-on-year revenue movement and the very high 90% seasonality index: earnings are healthy but increasingly concentrated in summer, so annualised projections built on peak months will overstate winter reality.
Monthly Airbnb occupancy in Seattle
Average occupancy rate by month in Seattle, compared with the same month a year earlier.
| Month | Occupancy | Prior year |
|---|---|---|
| Oct 2025 | 60.9% | 63.9% |
| Nov 2025 | 58.3% | 59.2% |
| Dec 2025 | 55.5% | 57.1% |
| Jan 2026 | 49.5% | 51.3% |
| Feb 2026 | 57.3% | 59.9% |
| Mar 2026 | 64.4% | 67.4% |
| Apr 2026 | 61.3% | 63.7% |
| May 2026 | 66.6% | 68.8% |
| Jun 2026 | 71.7% | 81.3% |
| Jul 2026 | 75.4% | 81.3% |
| Aug 2026 | 74.2% | 76.1% |
Historical Airbnb occupancy in Seattle (last 12 months)
📌 Historical trends reveal seasonal highs – plan accordingly.
Airbnb occupancy forecast in Seattle (next 90 days)
These figures reflect real-time demand in Seattle, helping you plan and price strategically.
Why people book Airbnbs in Seattle
Seattle's short-term rental demand is anchored by its role as the Pacific Northwest's tech and business gateway. Amazon's South Lake Union headquarters, nearby Microsoft in Redmond, Boeing, Starbucks and Nordstrom pull a steady year-round stream of corporate travellers, contractors and relocating new hires who need furnished stays of a week or more. This business base is what keeps Seattle's occupancy unusually firm even outside the summer high season.
Leisure demand layers on top of it. Visitors come for Pike Place Market, the Space Needle and Seattle Center, the waterfront and ferries, and as the embarkation port for Alaska cruises, which feed a wave of pre- and post-cruise nights from late spring through early autumn. The mix of recession-resistant corporate stays and seasonal tourism makes Seattle a more stable market for hosts than purely vacation-driven cities.
When Airbnb demand peaks in Seattle
Seattle is sharply seasonal: the analysis shows a 90% seasonality index, among the highest of any US market we track. July and June are the strongest months, when the region's famously dry, mild summer arrives and the cruise and outdoor seasons peak; February and January are the weakest, dominated by grey, wet weather and minimal leisure travel.
Events reinforce the summer skew. Northwest Folklife Festival fills Seattle Center over Memorial Day weekend (May 22-25, 2026), Seafair brings hydroplane races and the Blue Angels air show across late July and early August, and Bumbershoot returns Labor Day weekend (September 5-6, 2026). Hosts should price aggressively from June through early September and lean on weekly business stays to cushion the deep winter trough.
Best neighbourhoods for short-term rentals in Seattle
The strongest short-term rental districts cluster around downtown and the cultural core. Downtown and Belltown put guests within walking distance of Pike Place Market and the waterfront cruise terminals, commanding the highest nightly rates but facing the most competition. South Lake Union is the corporate play, surrounded by Amazon offices and ideal for extended business stays, while First Hill and Capitol Hill draw younger leisure guests with their dense restaurant, bar and nightlife scenes.
Further out, Queen Anne offers quieter, view-oriented stays near the Space Needle and is popular with families, and West Seattle and Ballard trade central location for residential calm and lower acquisition costs. Because Seattle's rules favour primary-residence operators, much of the realistic inventory is single units in these residential neighbourhoods rather than investor-held buildings downtown.
Short-term rental rules in Seattle
Seattle regulates short-term rentals (stays under 30 consecutive nights) through the Seattle Department of Construction and Inspections. Operators need two credentials: a Seattle Business License Tax Certificate and a Short-Term Rental Operator licence, together costing about $150 per year. The valid licence number must appear on every listing.
The key constraint is the primary-residence cap: most operators may run at most two short-term rentals, and one must be their own primary home, occupied at least six months of the year. A non-primary second unit additionally requires RRIO rental registration. This framework deliberately limits whole-building investor operations, so plan acquisitions around units you can legitimately tie to a primary residence.
Tools & strategies for Seattle
Revenue Management in Seattle
We help you increase revenue in Seattle with pricing algorithms and active monitoring.
Learn moreDynamic Pricing in Seattle
Our engine auto-adjusts prices based on demand and local events in Seattle.
Learn moreChannel Manager in Seattle
Manage listings on Airbnb, Booking.com and Vrbo in one place across Seattle.
Learn moreCheck your Airbnb in United States
And around the world
Other cities in United States
Compare performance across markets – occupancy, nightly prices and seasonality for other destinations in United States.
New York
76%
Los Angeles
75%
Chicago
64%
Houston
56%
Phoenix
63%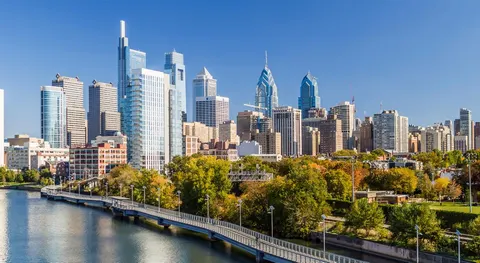
Philadelphia
60%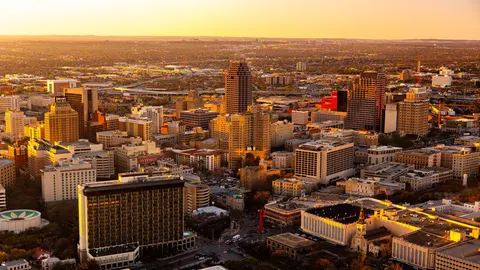
San Antonio
56%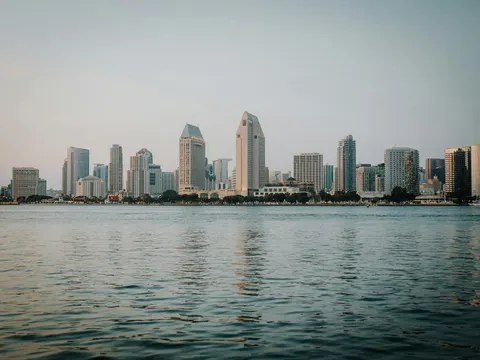
San Diego
65%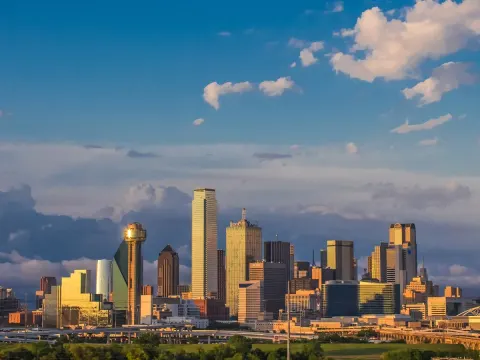
Dallas
60%
Austin
58%
Indianapolis
57%
San Francisco
74%
Nashville
58%
Denver
68%
Washington
64%
Las Vegas
59%
Kansas City
61%
Atlanta
55%
Miami
61%
Tampa
59%
New Orleans
54%
Honolulu
74%
Orlando
61%
Pittsburgh
58%
Scottsdale
63%
Tacoma
61%
Fayetteville
50%
Salt Lake City
66%
Athens
45%
Davenport
61%
Santa Fe
61%
Miami Beach
61%
Daytona Beach
53%
Idaho Falls
53%
Galveston
43%
Venice
75%
South Lake Tahoe
46%
Durango
49%
Panama City Beach
55%
Santa Rosa Beach
53%
Lahaina
64%
Little River
51%
Alamosa
52%Kill Devil Hills
51%Dripping Springs
58%
Carterville
55%
Big Bear Lake
36%
Rockaway Beach
54%
The Sea Ranch
53%
Springville
48%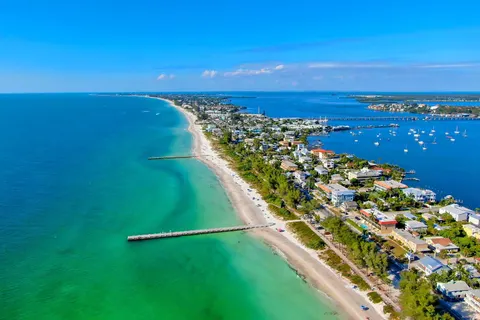
Anna Maria
61%Calculate your earnings potential in Seattle
Discover how much more you could earn by optimizing your listings with ListingOK
Your listings
How do we achieve these results?
AI Dynamic Pricing
Occupancy Optimization
Market Analysis
24/7 Expert Support
In line with our best results!
Get your full report
Detailed analysis and personalized recommendations
* Calculations based on 30 days/month. Actual results may vary depending on market, season, property type, and implemented strategy.
Suggest a new city in United States
Frequently asked questions about Airbnb occupancy in Seattle
Over the June 2025 to May 2026 period, Seattle listings averaged 66% occupancy, equivalent to roughly 237 booked nights a year. That sits about six points above the 60% US average and ranks 7th of the 39 American markets we track, driven by steady year-round corporate demand from Amazon, Microsoft and Boeing alongside summer tourism.
June through early September is by far the strongest stretch, with July and June peaking as the dry summer, Alaska cruise season and outdoor festivals converge. Seafair in late July to early August and Bumbershoot over Labor Day add demand spikes. February and January are the weakest months, so price aggressively in summer and target weekly business stays in winter.
Yes. You need both a Seattle Business License Tax Certificate and a Short-Term Rental Operator licence from the Department of Construction and Inspections, costing about $150 a year combined, and the licence number must appear on your listing. Most operators are capped at two rentals, one of which must be their primary residence occupied at least six months yearly.
Downtown and Belltown earn the highest nightly rates thanks to proximity to Pike Place Market and the cruise terminals, while South Lake Union suits extended corporate stays near Amazon. Capitol Hill and First Hill draw younger leisure guests, and Queen Anne, Ballard and West Seattle offer quieter residential stays with lower acquisition costs and better fit for the primary-residence rules.