
Airbnb Occupancy Rate in Nashville, United States, Data & Trends 2026
Curious about the performance of short-term rentals in Nashville, United States? Over the last year, the average occupancy rate was 58% with an average nightly price (ADR) of 250€. Hosts earned on average 4094€ per month.

📩 Send me this report and get it in my inbox every month
90-day occupancy forecast for Nashville so you can update rates and stay ahead of competitors.
Market summary in Nashville
Key metrics to optimize your pricing strategy
Avg. monthly earnings
4094€
$3726 USD
YoY Revenue Change
-3%
vs. previous year
Occupancy Rate
58%
~17 days/month
Average Daily Rate
250€
$228 USD
Seasonality Index
65%
demand variation
Best Months
May, June
peak season
Worst Months
January, February
low season
Revenue Management in Nashville
Our AI-powered platform automatically optimizes your rates. Maximize your revenue with intelligent dynamic pricing.
What Nashville's occupancy and nightly prices actually mean
Over the analysis period of June 2025 to May 2026, Nashville averaged 57% occupancy on a $224 ADR, producing roughly $3,641 in monthly revenue per listing. Occupancy sits about three points below the US city average of around 60%, but the picture flips on price: Nashville's nightly rate ranks among the highest of the 39 US markets we track, well above the national average, reflecting the premium for group-friendly, event-driven stays.
That high-ADR, moderate-occupancy profile is typical of a destination that fills powerfully on weekends and event dates but softens mid-week and in winter, signalled by a steep 66% seasonality index. Revenue was down 9% year-on-year, consistent with new supply and cooling rates across many US leisure markets, so the realistic strategy is aggressive event-based pricing rather than chasing year-round occupancy.
Monthly Airbnb occupancy in Nashville
Average occupancy rate by month in Nashville, compared with the same month a year earlier.
| Month | Occupancy | Prior year |
|---|---|---|
| Oct 2025 | 65.5% | 64.6% |
| Nov 2025 | 57% | 55.1% |
| Dec 2025 | 50.7% | 48.9% |
| Jan 2026 | 43.2% | 43.1% |
| Feb 2026 | 58.8% | 52.9% |
| Mar 2026 | 65.5% | 64.6% |
| Apr 2026 | 61.5% | 59.9% |
| May 2026 | 66.1% | 66% |
| Jun 2026 | 67.3% | 65.8% |
| Jul 2026 | 63.5% | 63.8% |
| Aug 2026 | 57.1% | 59.4% |
Historical Airbnb occupancy in Nashville (last 12 months)
📌 Historical trends reveal seasonal highs – plan accordingly.
Airbnb occupancy forecast in Nashville (next 90 days)
These figures reflect real-time demand in Nashville, helping you plan and price strategically.
Why people book Airbnbs in Nashville
Nashville is one of the United States' most music-driven leisure destinations, and that singular identity shapes Airbnb demand here. Visitors come for Lower Broadway's honky-tonk strip, the Grand Ole Opry, the Ryman Auditorium and Country Music Hall of Fame, and a constant flow of bachelorette and bachelor parties drawn to the downtown bar scene. Music City's reputation as a weekend-getaway capital means group bookings, pedal-tavern crowds and short two-to-three-night stays dominate, which pushes nightly rates well above the national norm.
Beyond tourism, Nashville's growth as a corporate and healthcare hub (it is home to a large hospital-management industry and a busy convention calendar at Music City Center) layers steady mid-week and business demand on top of the leisure peaks. The result is a market where larger, well-located homes that can sleep groups command a premium, while standard apartments compete on a more typical occupancy basis.
When Airbnb demand peaks in Nashville
Demand in Nashville peaks in spring and autumn. May and October are the strongest months, helped by mild weather and a packed events calendar: CMA Fest fills downtown for four days in early June (June 4-7 in 2026, drawing more than 95,000 fans nightly to Nissan Stadium and free Broadway stages), and the spring-through-fall stretch of concerts, festivals and bachelorette weekends keeps weekends busy from April to October.
The low season is clear-cut: January and February are the weakest months, when cold weather and a quiet events calendar thin out leisure travel. Summer stays warm and humid with July highs above 90F, which supports volume but not premium pricing. Managers should plan for sharp weekend-versus-weekday swings and lean on event dates to set rates rather than relying on a flat seasonal curve.
Best neighbourhoods for short-term rentals in Nashville
Downtown and the SoBro/Gulch corridor are the highest-demand zones for short-term rentals, putting guests within walking distance of Broadway, Music City Center and the stadium. The Gulch in particular is the city's most polished, walkable district, with converted industrial buildings and boutique appeal that justify top nightly rates. These areas also draw the heaviest regulatory scrutiny.
East Nashville offers a hip, dining-led alternative across the river that attracts repeat and local-flavour travellers; Germantown, the historic district near the stadium, blends Victorian charm with strong restaurants; and 12 South, Music Row and Midtown sit slightly out from the core, trading walk-to-Broadway convenience for quieter streets and more residential character. For non-owner-occupied operators, zoning matters as much as location, since residential districts now block new investor permits.
Short-term rental rules in Nashville
Nashville (Metro Nashville-Davidson County) requires a Short Term Rental Property permit before listing, issued in two categories: owner-occupied and non-owner-occupied. Owner-occupied permits require the owner to live on-site (or in an adjacent unit), cap the property at four sleeping rooms, and demand multiple current documents proving residency. Permits expire 365 days after issue and must be renewed before expiry.
The critical constraint for investors is that Metro no longer issues new non-owner-occupied permits in residential zoning districts (including AR2A, R, RS and RM zones), so purely investment STRs are largely confined to commercial and mixed-use areas. Non-owner-occupied operators must also name a responsible party living within a 25-mile radius and meet safety and fee requirements. Anyone buying to operate should confirm the parcel's zoning and existing permit status before committing.
Tools & strategies for Nashville
Revenue Management in Nashville
We help you increase revenue in Nashville with pricing algorithms and active monitoring.
Learn moreDynamic Pricing in Nashville
Our engine auto-adjusts prices based on demand and local events in Nashville.
Learn moreChannel Manager in Nashville
Manage listings on Airbnb, Booking.com and Vrbo in one place across Nashville.
Learn moreCheck your Airbnb in United States
And around the world
Other cities in United States
Compare performance across markets – occupancy, nightly prices and seasonality for other destinations in United States.
New York
76%
Los Angeles
75%
Chicago
64%
Houston
56%
Phoenix
63%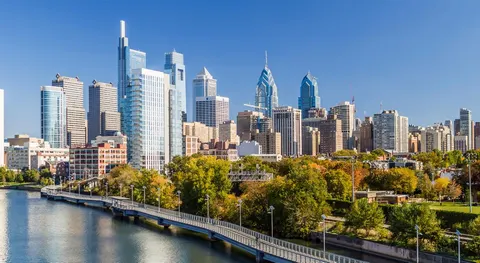
Philadelphia
60%
San Antonio
56%
San Diego
65%
Dallas
60%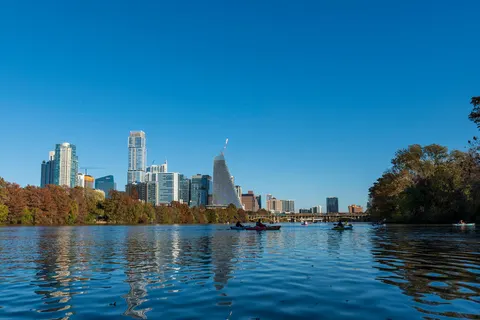
Austin
58%
Indianapolis
57%
San Francisco
74%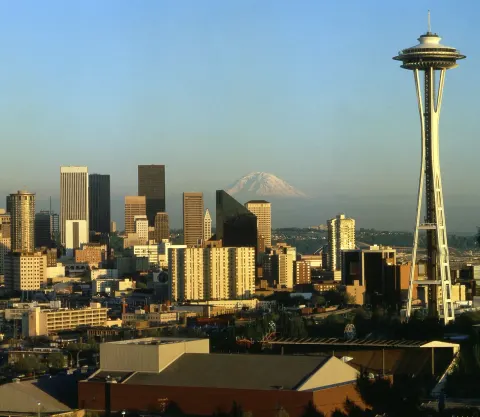
Seattle
64%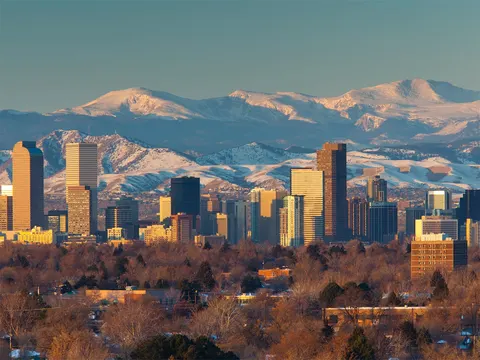
Denver
68%
Washington
64%
Las Vegas
59%
Kansas City
61%
Atlanta
55%
Miami
61%
Tampa
59%
New Orleans
54%
Honolulu
74%
Orlando
61%
Pittsburgh
58%
Scottsdale
63%
Tacoma
61%
Fayetteville
50%
Salt Lake City
66%
Athens
45%
Davenport
61%
Santa Fe
61%
Miami Beach
61%
Daytona Beach
53%
Idaho Falls
53%
Galveston
43%
Venice
75%
South Lake Tahoe
46%
Durango
49%
Panama City Beach
55%
Santa Rosa Beach
53%
Lahaina
64%
Little River
51%
Alamosa
52%Kill Devil Hills
51%Dripping Springs
58%
Carterville
55%
Big Bear Lake
36%
Rockaway Beach
54%
The Sea Ranch
53%
Springville
48%
Anna Maria
61%Calculate your earnings potential in Nashville
Discover how much more you could earn by optimizing your listings with ListingOK
Your listings
How do we achieve these results?
AI Dynamic Pricing
Occupancy Optimization
Market Analysis
24/7 Expert Support
In line with our best results!
Get your full report
Detailed analysis and personalized recommendations
* Calculations based on 30 days/month. Actual results may vary depending on market, season, property type, and implemented strategy.
Suggest a new city in United States
Frequently asked questions about Airbnb occupancy in Nashville
Nashville Airbnbs averaged about 57% occupancy over the June 2025 to May 2026 period, a few points below the US city average of roughly 60%. The market compensates with high nightly rates rather than high occupancy, so well-located, group-friendly homes can still perform strongly despite the moderate fill rate.
May and October are the strongest months, with the April-to-October stretch carrying most demand thanks to mild weather and a dense events calendar. CMA Fest in early June (June 4-7 in 2026) is a standout peak. January and February are the weakest, so concentrate revenue on weekends and event dates.
Yes. Metro Nashville requires a Short Term Rental Property permit, either owner-occupied or non-owner-occupied, with a four-bedroom cap and annual renewal. Crucially, new non-owner-occupied (investor) permits are no longer issued in residential zones, so verify a property's zoning and permit eligibility before buying to operate.
Downtown, SoBro and The Gulch command the highest rates for their walkability to Broadway and the stadium. East Nashville, Germantown and 12 South offer character-led demand slightly off the core. For investor rentals, zoning is decisive, as residential districts now block new non-owner-occupied permits.