
Airbnb Occupancy Rate in Miami, United States, Data & Trends 2026
Curious about the performance of short-term rentals in Miami, United States? Over the last year, the average occupancy rate was 61% with an average nightly price (ADR) of 232€. Hosts earned on average 3841€ per month.

📩 Send me this report and get it in my inbox every month
90-day occupancy forecast for Miami so you can update rates and stay ahead of competitors.
Market summary in Miami
Key metrics to optimize your pricing strategy
Avg. monthly earnings
3841€
$3495 USD
YoY Revenue Change
-3%
vs. previous year
Occupancy Rate
61%
~18 days/month
Average Daily Rate
232€
$211 USD
Seasonality Index
75%
demand variation
Best Months
March, February
peak season
Worst Months
September, August
low season
Revenue Management in Miami
Our AI-powered platform automatically optimizes your rates. Maximize your revenue with intelligent dynamic pricing.
What Miami's occupancy and nightly prices actually mean
Over the analysis period June 2025 to May 2026, Miami averaged 62% occupancy with an ADR of $206 (227€) and roughly $3,461 (3,807€) in monthly revenue per listing. Occupancy runs just under two points above the US city average of about 60%, but the ADR is the real differentiator: at 227€ it sits well above the national average of around 202€, which is what lifts monthly revenue above typical US markets.
The seasonality index of 75% is high, confirming a market that swings hard between the busy dry-season peak (best months March and February) and the soft summer trough (worst months September and August). Revenue was down 4% year over year, a mild softening rather than a collapse, with listings booking an average of 224 nights across the year.
Monthly Airbnb occupancy in Miami
Average occupancy rate by month in Miami, compared with the same month a year earlier.
| Month | Occupancy | Prior year |
|---|---|---|
| Oct 2025 | 60.9% | 61.1% |
| Nov 2025 | 62.4% | 60% |
| Dec 2025 | 62.1% | 62.9% |
| Jan 2026 | 68.4% | 60.1% |
| Feb 2026 | 71.5% | 69.6% |
| Mar 2026 | 69.7% | 66.3% |
| Apr 2026 | 53.9% | 52.9% |
| May 2026 | 55.5% | 56.5% |
| Jun 2026 | 56% | 60.8% |
| Jul 2026 | 52.7% | 61.8% |
| Aug 2026 | 53.8% | 57.7% |
Historical Airbnb occupancy in Miami (last 12 months)
📌 Historical trends reveal seasonal highs – plan accordingly.
Airbnb occupancy forecast in Miami (next 90 days)
These figures reflect real-time demand in Miami, helping you plan and price strategically.
Why people book Airbnbs in Miami
Miami draws a year-round mix of leisure tourists, Latin American and European travellers, snowbirds escaping northern winters, and a steady flow of business visitors tied to Brickell's banking and trade economy. Beach demand from South Beach and the wider Miami Beach barrier island anchors the leisure side, while cruise traffic through PortMiami and convention business at the Miami Beach Convention Center keep midweek bookings alive.
For Airbnb operators this means a guest base that is far more international and event-driven than most US markets. Spanish-speaking visitors, repeat winter residents, and groups attending festivals and sporting events all feed short-stay demand. The combination of beach, nightlife, and a major financial district lets well-located rentals command premium nightly rates that sit well above the national average.
When Airbnb demand peaks in Miami
Miami's strong season is the November-to-April dry season, when warm, rain-free weather pulls in northern visitors and pushes occupancy and rates to their yearly highs. The single biggest demand spikes land in late winter and early spring: the Calle Ocho Music Festival (March 15, 2026), Miami Music Week and Ultra Music Festival at Bayfront Park (March 24-29, 2026), and the Formula 1 Miami Grand Prix (May 1-3, 2026). Art Basel Miami Beach (December 4-6, 2026, with Art Week running roughly December 1-7) fills hotels and rentals city-wide in early December.
The low season is the wet, humid summer that overlaps hurricane season (June 1 to November 30, peaking mid-August through September). Miami's worst months for occupancy are September and August, when storm risk and heat thin out leisure travel; the strongest are March and February, on the back of dry-season weather and the spring event calendar.
Best neighbourhoods for short-term rentals in Miami
South Beach and the Miami Beach barrier island are the highest-demand zones for short-term rental, driven by beach access, Art Deco appeal, and nightlife, but they also carry the strictest local rules. Brickell and Downtown skew toward business travellers and event guests, with high-rise condos that suit shorter professional stays. Wynwood and the Design District attract a younger, design-led crowd around galleries, murals, and restaurants.
Little Havana offers culturally distinctive, lower-priced stays close to the centre, while Coconut Grove and Coral Gables provide quieter, leafier, family-oriented rentals. Operators should note that regulation varies sharply by jurisdiction: the City of Miami, Miami Beach, and unincorporated Miami-Dade County each set their own rules, so the same listing can be straightforward in one neighbourhood and heavily restricted a few blocks away.
Short-term rental rules in Miami
Short-term rental rules in Greater Miami depend on which jurisdiction the property sits in, and they are enforced unevenly. In unincorporated Miami-Dade County, operators need a Certificate of Use from the county (about $136 including the required inspection, renewed annually), a Local Business Tax Receipt, and a Florida DBPR vacation rental licence (around $170 per year, renewing each October 1). Condo and HOA-governed properties also require written association approval.
Individual cities layer on their own restrictions. The City of Miami and Miami Beach in particular limit where and how short stays can operate, with Miami Beach among the most aggressive on enforcement and fines. Compliance rates are low in practice, but penalties for unlicensed operation can be steep, so confirm the exact rules for your specific address and jurisdiction before listing.
Tools & strategies for Miami
Revenue Management in Miami
We help you increase revenue in Miami with pricing algorithms and active monitoring.
Learn moreDynamic Pricing in Miami
Our engine auto-adjusts prices based on demand and local events in Miami.
Learn moreChannel Manager in Miami
Manage listings on Airbnb, Booking.com and Vrbo in one place across Miami.
Learn moreCheck your Airbnb in United States
And around the world
Other cities in United States
Compare performance across markets – occupancy, nightly prices and seasonality for other destinations in United States.
New York
76%
Los Angeles
75%
Chicago
64%
Houston
56%
Phoenix
63%
Philadelphia
60%
San Antonio
56%
San Diego
65%
Dallas
60%
Austin
58%
Indianapolis
57%
San Francisco
74%
Seattle
64%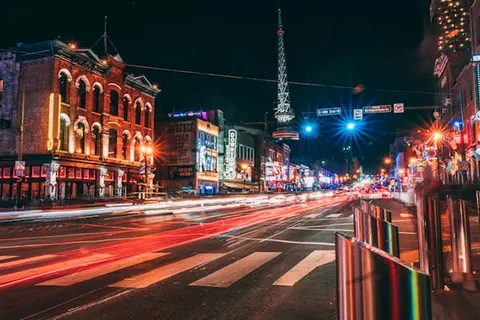
Nashville
58%
Denver
68%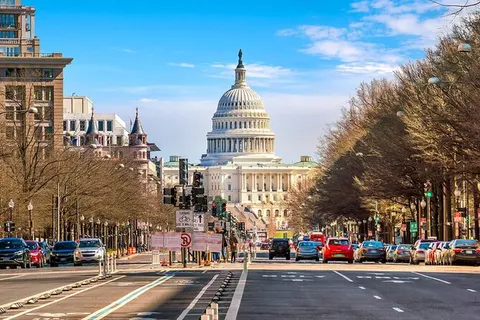
Washington
64%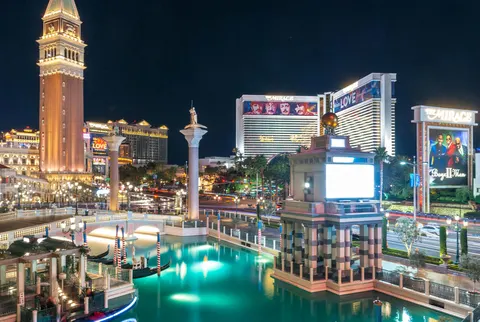
Las Vegas
59%
Kansas City
61%
Atlanta
55%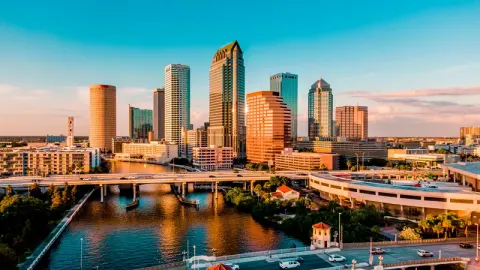
Tampa
59%
New Orleans
54%
Honolulu
74%
Orlando
61%
Pittsburgh
58%
Scottsdale
63%
Tacoma
61%
Fayetteville
50%
Salt Lake City
66%
Athens
45%
Davenport
61%
Santa Fe
61%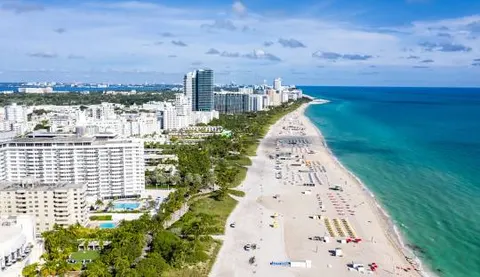
Miami Beach
61%
Daytona Beach
53%
Idaho Falls
53%
Galveston
43%
Venice
75%
South Lake Tahoe
46%
Durango
49%
Panama City Beach
55%
Santa Rosa Beach
53%
Lahaina
64%
Little River
51%
Alamosa
52%Kill Devil Hills
51%Dripping Springs
58%
Carterville
55%
Big Bear Lake
36%
Rockaway Beach
54%
The Sea Ranch
53%
Springville
48%
Anna Maria
61%Calculate your earnings potential in Miami
Discover how much more you could earn by optimizing your listings with ListingOK
Your listings
How do we achieve these results?
AI Dynamic Pricing
Occupancy Optimization
Market Analysis
24/7 Expert Support
In line with our best results!
Get your full report
Detailed analysis and personalized recommendations
* Calculations based on 30 days/month. Actual results may vary depending on market, season, property type, and implemented strategy.
Suggest a new city in United States
Frequently asked questions about Airbnb occupancy in Miami
Over the June 2025 to May 2026 period, Miami listings averaged 62% occupancy, just above the US city average of around 60%. That works out to roughly 224 booked nights per year. Combined with a high ADR of about $206, it produces around $3,461 in monthly revenue per listing, above most US markets.
The dry season from November to April is strongest, peaking in March and February. The biggest demand drivers are Miami Music Week and Ultra (March 24-29, 2026), Calle Ocho (March 15), the F1 Grand Prix (May 1-3) and Art Basel (December 4-6). September and August are the weakest, hit by heat and hurricane season.
Yes. In unincorporated Miami-Dade you need a county Certificate of Use (about $136 a year including inspection), a Local Business Tax Receipt, and a Florida DBPR vacation rental licence (around $170 a year, renewing each October 1). Condo and HOA properties also need written association approval, and individual cities add their own rules.
South Beach and Miami Beach command the highest demand but face the strictest rules. Brickell and Downtown suit business and event guests, while Wynwood and the Design District draw a younger crowd. Little Havana, Coconut Grove and Coral Gables offer quieter or cheaper options. Always check the rules for your specific jurisdiction first.