
Airbnb Occupancy Rate in Philadelphia, United States, Data & Trends 2026
Curious about the performance of short-term rentals in Philadelphia, United States? Over the last year, the average occupancy rate was 60% with an average nightly price (ADR) of 132€. Hosts earned on average 2237€ per month.

📩 Send me this report and get it in my inbox every month
90-day occupancy forecast for Philadelphia so you can update rates and stay ahead of competitors.
Market summary in Philadelphia
Key metrics to optimize your pricing strategy
Avg. monthly earnings
2237€
$2036 USD
YoY Revenue Change
1%
vs. previous year
Occupancy Rate
60%
~18 days/month
Average Daily Rate
132€
$120 USD
Seasonality Index
59%
demand variation
Best Months
June, July
peak season
Worst Months
February, January
low season
Revenue Management in Philadelphia
Our AI-powered platform automatically optimizes your rates. Maximize your revenue with intelligent dynamic pricing.
What Philadelphia's occupancy and nightly prices actually mean
Over the June 2025 to May 2026 analysis period, Philadelphia ran 61% average occupancy, sitting right on the US national average of roughly 60% across the cities we track. Where it stands apart is price: an ADR of $115 (127 euro) is among the lowest of any major US market we cover, well under the national average near 202 euro, which is why average monthly revenue lands at a modest $1,975 (2,173 euro).
The trade-off is stability. Revenue is down just 4% year over year, milder than most US cities in the same period, and seasonality of 54% is moderate rather than volatile. Philadelphia is a steady, volume-driven market that compensates for soft nightly rates with consistent occupancy and reliable mid-week fill.
Monthly Airbnb occupancy in Philadelphia
Average occupancy rate by month in Philadelphia, compared with the same month a year earlier.
| Month | Occupancy | Prior year |
|---|---|---|
| Oct 2025 | 67.4% | 69.3% |
| Nov 2025 | 62.7% | 62.6% |
| Dec 2025 | 56.2% | 58.4% |
| Jan 2026 | 56.7% | 53.5% |
| Feb 2026 | 60.7% | 60.7% |
| Mar 2026 | 63.1% | 61.5% |
| Apr 2026 | 62.8% | 65.2% |
| May 2026 | 67.4% | 65.9% |
| Jun 2026 | 63.9% | 68.9% |
| Jul 2026 | 64.7% | 65.7% |
| Aug 2026 | 59.9% | 64.4% |
Historical Airbnb occupancy in Philadelphia (last 12 months)
📌 Historical trends reveal seasonal highs – plan accordingly.
Airbnb occupancy forecast in Philadelphia (next 90 days)
These figures reflect real-time demand in Philadelphia, helping you plan and price strategically.
Why people book Airbnbs in Philadelphia
Philadelphia draws short-term-rental demand from three overlapping streams: heritage tourism around Independence Hall and the Liberty Bell, a steady flow of conference and convention guests at the Pennsylvania Convention Center, and university-driven visitors tied to the University of Pennsylvania, Drexel and Temple. Parents on campus visits, graduation weekends and medical patients heading to the University City hospital cluster fill mid-week and shoulder-season nights that pure leisure cities cannot.
The city sits inside the Northeast corridor, two hours by train from both New York and Washington, so it absorbs spillover whenever those markets sell out. Demand is broad-based rather than spiky, and 2026 is unusual: America250 programming and FIFA World Cup matches at Lincoln Financial Field are stretching the peak well beyond a normal summer.
When Airbnb demand peaks in Philadelphia
The analysis period (June 2025 to May 2026) puts the strongest months at May and June, when warm weather, university graduations and the start of the festival calendar overlap. The weakest months are February and January, when cold weather and the post-holiday lull thin out bookings.
Key demand drivers are dated: the Wawa Welcome America festival runs June 19 to July 4, 2026 (the America250 edition) and lifts early-summer rates; the PHS Philadelphia Flower Show (February 28 to March 8, 2026) is the one event that rescues an otherwise dead late-winter; and the Made in America festival on October 10-11, 2026 spikes a single autumn weekend. Hosts should hold firm pricing around these windows rather than discounting into the quiet first quarter.
Best neighbourhoods for short-term rentals in Philadelphia
Center City is the safest core for short-term rental: walkable, close to the Convention Center and Rittenhouse Square dining, and it commands the highest weekday business and conference demand. Old City, the historic square mile around Independence National Historical Park, is the leisure-tourist heartland, packed with the founding-era sites guests come for plus a strong nightlife and waterfront scene.
University City, anchored by Penn and Drexel, runs on academic and medical demand and stays busy mid-week and through graduation season. Fishtown and Northern Liberties, the former industrial waterfront northeast of Center City, now pull a younger crowd with craft food, live music and independent shops, and reward hosts targeting weekend leisure travellers over corporate guests.
Short-term rental rules in Philadelphia
Philadelphia regulates short-term rentals tightly. Hosts renting their primary residence need a Limited Lodging Operator License (about $150 as of 2025) plus a Limited Lodging zoning use; hosts renting a property they do not live in need a Rental License with Hotel designation and a Visitor Accommodation zoning use (about $250). A Commercial Activity License is also required.
Applicants must collect and remit the city Hotel Tax along with state and local sales taxes, and from July 1, 2025 the city runs virtual inspections at each license application and renewal. Enforcement is real, platforms increasingly require a license number on the listing, and around 90% of active Philadelphia listings now carry one. Confirm the current rules with the Philadelphia Department of Licenses and Inspections before listing.
Tools & strategies for Philadelphia
Revenue Management in Philadelphia
We help you increase revenue in Philadelphia with pricing algorithms and active monitoring.
Learn moreDynamic Pricing in Philadelphia
Our engine auto-adjusts prices based on demand and local events in Philadelphia.
Learn moreChannel Manager in Philadelphia
Manage listings on Airbnb, Booking.com and Vrbo in one place across Philadelphia.
Learn moreCheck your Airbnb in United States
And around the world
Other cities in United States
Compare performance across markets – occupancy, nightly prices and seasonality for other destinations in United States.
New York
76%
Los Angeles
75%
Chicago
64%
Houston
56%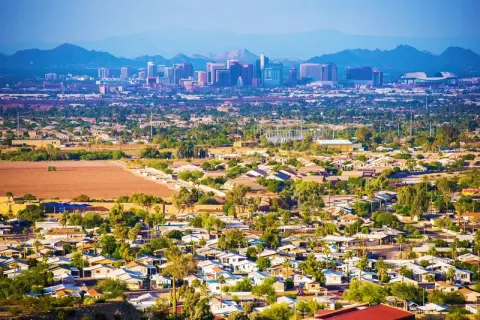
Phoenix
63%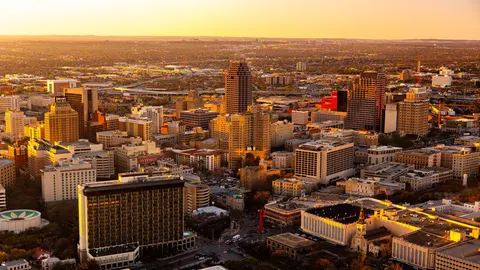
San Antonio
56%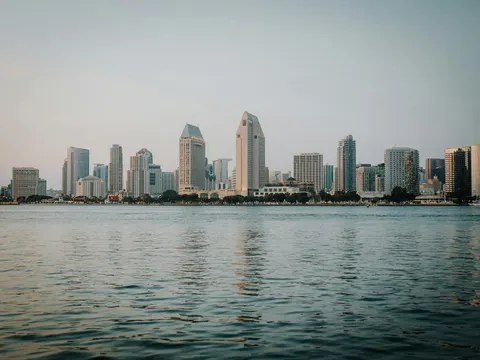
San Diego
65%
Dallas
60%
Austin
58%
Indianapolis
57%
San Francisco
74%
Seattle
64%
Nashville
58%
Denver
68%
Washington
64%
Las Vegas
59%
Kansas City
61%
Atlanta
55%
Miami
61%
Tampa
59%
New Orleans
54%
Honolulu
74%
Orlando
61%
Pittsburgh
58%
Scottsdale
63%
Tacoma
61%
Fayetteville
50%
Salt Lake City
66%
Athens
45%
Davenport
61%
Santa Fe
61%
Miami Beach
61%
Daytona Beach
53%
Idaho Falls
53%
Galveston
43%
Venice
75%
South Lake Tahoe
46%
Durango
49%
Panama City Beach
55%
Santa Rosa Beach
53%
Lahaina
64%
Little River
51%
Alamosa
52%Kill Devil Hills
51%Dripping Springs
58%
Carterville
55%
Big Bear Lake
36%
Rockaway Beach
54%
The Sea Ranch
53%
Springville
48%
Anna Maria
61%Calculate your earnings potential in Philadelphia
Discover how much more you could earn by optimizing your listings with ListingOK
Your listings
How do we achieve these results?
AI Dynamic Pricing
Occupancy Optimization
Market Analysis
24/7 Expert Support
In line with our best results!
Get your full report
Detailed analysis and personalized recommendations
* Calculations based on 30 days/month. Actual results may vary depending on market, season, property type, and implemented strategy.
Suggest a new city in United States
Frequently asked questions about Airbnb occupancy in Philadelphia
Philadelphia averaged 61% occupancy over the June 2025 to May 2026 analysis period, essentially matching the roughly 60% US national average across the markets we track. That works out to about 218 booked nights per year, with the strongest demand concentrated in May and June and the weakest in January and February.
May and June are the peak months, helped by university graduations and the Wawa Welcome America festival (June 19 to July 4, 2026). October brings a sharp weekend spike around the Made in America festival, and the PHS Flower Show (late February to early March) lifts an otherwise quiet first quarter. January and February are the softest months.
Yes. Primary-residence hosts need a Limited Lodging Operator License (about $150) and the matching zoning use; non-resident hosts need a Rental License with Hotel designation plus a Visitor Accommodation use (about $250) and a Commercial Activity License. You must collect Hotel Tax, and the city runs virtual inspections at application and renewal since July 2025.
Center City is the strongest all-round choice for business, conference and walkable leisure demand. Old City suits history-focused tourists near Independence Hall. University City delivers steady academic and medical bookings, while Fishtown and Northern Liberties attract younger weekend travellers drawn by the food, music and nightlife scene.