
Airbnb Occupancy Rate in Dripping Springs, United States, Data & Trends 2026
Curious about the performance of short-term rentals in Dripping Springs, United States? Over the last year, the average occupancy rate was 58% with an average nightly price (ADR) of 184€. Hosts earned on average 3010€ per month.

📩 Send me this report and get it in my inbox every month
90-day occupancy forecast for Dripping Springs so you can update rates and stay ahead of competitors.
Market summary in Dripping Springs
Key metrics to optimize your pricing strategy
Avg. monthly earnings
3010€
$2739 USD
YoY Revenue Change
-3%
vs. previous year
Occupancy Rate
58%
~17 days/month
Average Daily Rate
184€
$167 USD
Seasonality Index
52%
demand variation
Best Months
March, July
peak season
Worst Months
January, February
low season
Revenue Management in Dripping Springs
Our AI-powered platform automatically optimizes your rates. Maximize your revenue with intelligent dynamic pricing.
What Dripping Springs's occupancy and nightly prices actually mean
The set: 57% occupancy, €182 ADR, €2,921 average monthly revenue, revenue down 8% year on year, 206 occupied nights. Occupancy and total nights are the strongest of comparable markets, and combined with the flat seasonality curve (index 53) they describe a dependable, plannable business — closer to a steady hospitality operation than a boom-bust beach town.
The -8% year on year is the caution flag, and here it is a supply story: this corner of the Hill Country has been building fast, and new large homes with pools enter the rental pool continuously, diluting rate. The defence is specialisation rather than discounting. A listing that markets directly to the wedding channel — venue proximity noted in the title, group amenities, getting-ready spaces, coordinated multi-house blocks for full guest lists — competes on fit, not price. Watch RevPAR rather than occupancy alone: at 57% occupancy the calendar is not the constraint; the €182 rate is where the next euro of revenue lives, and midweek nights are where the incremental occupancy hides.
Monthly Airbnb occupancy in Dripping Springs
Average occupancy rate by month in Dripping Springs, compared with the same month a year earlier.
| Month | Occupancy | Prior year |
|---|---|---|
| Oct 2025 | 60% | 60.2% |
| Nov 2025 | 55.3% | 53.9% |
| Dec 2025 | 53.3% | 52% |
| Jan 2026 | 52.9% | 51.2% |
| Feb 2026 | 62.4% | 61.5% |
| Mar 2026 | 66% | 66.5% |
| Apr 2026 | 59.7% | 57.7% |
| May 2026 | 61.2% | 57.5% |
| Jun 2026 | 63.2% | 59.8% |
| Jul 2026 | 64.4% | 59% |
| Aug 2026 | 60.1% | 55.3% |
| Sep 2026 | 59.7% | 54% |
Historical Airbnb occupancy in Dripping Springs (last 12 months)
📌 Historical trends reveal seasonal highs – plan accordingly.
Airbnb occupancy forecast in Dripping Springs (next 90 days)
These figures reflect real-time demand in Dripping Springs, helping you plan and price strategically.
Why people book Airbnbs in Dripping Springs
Dripping Springs holds an official state designation as the Wedding Capital of Texas, and that single fact explains most of its short-term-rental economics. Dozens of Hill Country wedding venues ring the town, and every wedding exports demand: couples' families, bridal parties and guest blocks who need houses — usually large ones — within a short drive of a specific venue. Layered on top is the drinks trail: the wineries, distilleries and craft breweries along US 290 and Fitzhugh Road pull weekend groups from Austin, which sits only about half an hour east. Hamilton Pool Preserve and the town's status as Texas's first International Dark Sky Community round out a genuinely year-round leisure case.
The numbers reflect that breadth: 57% occupancy — the strongest of comparable markets — on a €182 ADR, producing €2,921 in average monthly revenue. This is a group-travel market: bedroom count, outdoor space, pools and views do the selling, and the winning properties are built to host eight people celebrating something.
When Airbnb demand peaks in Dripping Springs
Dripping Springs scores just 53 on the seasonality index — one of the flattest demand curves we track, roughly half the variability of an average market. The reason is structural: weddings are booked across the whole calendar, not one season, so the demand floor never falls far. The best months are March, when Hill Country wildflower season begins, Austin's spring event calendar spills over and spring weddings start, and October, the heart of autumn wedding season with the year's best weather. January and February are the weakest — the one stretch when the wedding calendar and patio weather both go quiet.
A typical listing sold 206 nights across the year, the highest count among comparable markets. The operational read: this is a market where you can plan cash flow with unusual confidence, but the demand arrives compressed into weekends. Thursday-to-Sunday sells; Monday-to-Wednesday does not. Price weekends firmly year-round — even in February a wedding block can appear — and use midweek discounts, longer-stay offers and remote-work positioning to harvest the nights the wedding trade leaves behind.
Best neighbourhoods for short-term rentals in Dripping Springs
Dripping Springs is not a neighbourhood market; it is an acreage market. Inventory spreads across the Hill Country rather than clustering on walkable streets: ranch-style homes and modern builds along the US 290 corridor, properties near Fitzhugh Road's brewery-and-distillery strip, houses off Hamilton Pool Road toward the preserve, and a small cluster near the historic Mercer Street core, which supplies the closest thing to a walk-to-dinner stay. What replaces "location" in the urban sense is venue adjacency: being ten minutes from a cluster of wedding venues is worth more than any address prestige, because wedding parties book on drive time.
The product that wins is consistent: multiple bedrooms, a pool or hot tub, shaded outdoor living space, long views and dark-sky stargazing. Small one-bedroom units fight for a thinner couples' trade around the wineries. Note also that jurisdiction varies parcel by parcel — city limits, extraterritorial jurisdiction and unincorporated Hays County carry different rules — which affects both compliance and what neighbours can object to.
Short-term rental rules in Dripping Springs
Dripping Springs regulates short-term rentals on two fronts, and jurisdiction matters. Within the city and its extraterritorial jurisdiction, a 7% city hotel occupancy tax has applied since 2003, reported and remitted quarterly — and critically, Airbnb and Vrbo do not remit this city tax on the host's behalf, so operators must file it themselves on top of the state hotel occupancy tax. The city has also moved to a permit regime for short-term rentals: annual permits, proof of hotel-tax compliance, occupancy limits tied to bedroom count, and conditional use permits required in single-family and agricultural zoning districts, while commercial zones are exempt from that extra step.
Outside the city and its extraterritorial jurisdiction, unincorporated Hays County is considerably lighter-touch, in line with Texas's generally permissive stance, though state hotel occupancy tax still applies everywhere. Because parcels a few hundred metres apart can fall under different regimes, confirm which jurisdiction a property sits in first. Rules change; verify current permit requirements and tax registration with the City of Dripping Springs before listing.
Tools & strategies for Dripping Springs
Revenue Management in Dripping Springs
We help you increase revenue in Dripping Springs with pricing algorithms and active monitoring.
Learn moreDynamic Pricing in Dripping Springs
Our engine auto-adjusts prices based on demand and local events in Dripping Springs.
Learn moreChannel Manager in Dripping Springs
Manage listings on Airbnb, Booking.com and Vrbo in one place across Dripping Springs.
Learn moreCheck your Airbnb in United States
And around the world
Other cities in United States
Compare performance across markets – occupancy, nightly prices and seasonality for other destinations in United States.
New York
76%
Los Angeles
75%
Chicago
65%
Houston
56%
Phoenix
63%
Philadelphia
60%
San Antonio
56%
San Diego
66%
Dallas
60%
Austin
58%
Indianapolis
57%
San Francisco
74%
Seattle
64%
Nashville
58%
Denver
68%
Washington
65%
Las Vegas
59%
Kansas City
61%
Atlanta
55%
Miami
61%
Tampa
60%
New Orleans
55%
Honolulu
74%
Orlando
61%
Pittsburgh
58%
Scottsdale
63%
Tacoma
62%
Fayetteville
50%
Salt Lake City
66%
Athens
46%
Davenport
61%
Santa Fe
62%
Miami Beach
61%
Daytona Beach
54%
Idaho Falls
54%
Galveston
44%
Venice
75%
South Lake Tahoe
46%
Durango
49%
Panama City Beach
56%
Santa Rosa Beach
53%
Lahaina
64%
Little River
52%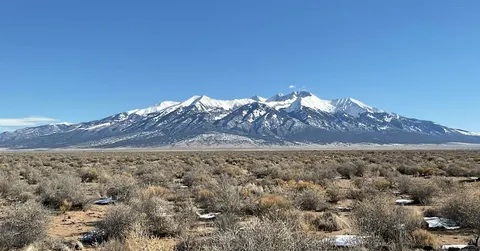
Alamosa
53%Kill Devil Hills
52%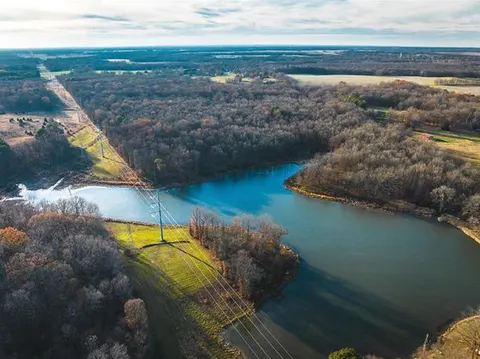
Carterville
55%
Big Bear Lake
37%
Rockaway Beach
54%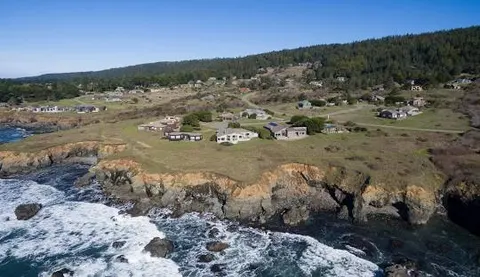
The Sea Ranch
53%
Springville
48%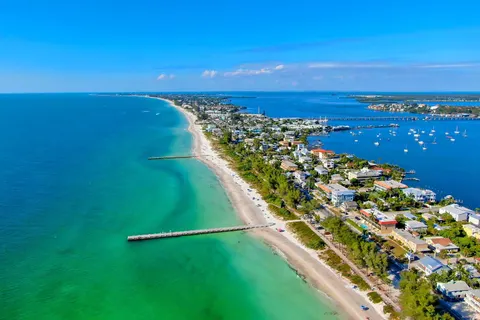
Anna Maria
61%Calculate your earnings potential in Dripping Springs
Discover how much more you could earn by optimizing your listings with ListingOK
Your listings
How do we achieve these results?
AI Dynamic Pricing
Occupancy Optimization
Market Analysis
24/7 Expert Support
In line with our best results!
Get your full report
Detailed analysis and personalized recommendations
* Calculations based on 30 days/month. Actual results may vary depending on market, season, property type, and implemented strategy.
Suggest a new city in United States
Frequently asked questions about Airbnb occupancy in Dripping Springs
It is one of the steadier ones we track: 57% occupancy, a €182 ADR and €2,921 in average monthly revenue, with a seasonality index of 53 — about half the swing of a typical market. The wedding calendar provides year-round demand. The caveat is competition: revenue slipped 8% year on year as new supply keeps arriving.
The market averages 57%, about 206 occupied nights a year — the strongest of comparable markets. But it is weekend-shaped: Thursday to Sunday fills readily on wedding and winery traffic, while midweek needs deliberate effort through discounts, longer-stay offers and remote-work positioning.
March and October are the peaks — spring wildflowers and the autumn wedding season respectively. January and February are the quiet stretch, when both weddings and patio weather pause. The rest of the year holds unusually steady, which is exactly what the low seasonality index of 53 captures.
Group homes. Weddings drive the market, and wedding parties book on bedroom count, pools, outdoor space and drive time to their venue. A four-bedroom house with a pool near a venue cluster will outearn two small cottages. Dark-sky views and hill vistas add real rate, not just listing charm.
Inside the city and its extraterritorial jurisdiction, expect a short-term-rental permit (with conditional use permits in single-family and agricultural zones) and a 7% city hotel occupancy tax filed quarterly — Airbnb and Vrbo do not remit the city tax for you. State hotel occupancy tax applies everywhere. Verify the parcel's jurisdiction and current rules with the city before listing.
The market ADR is €182, but averages mislead in a group market: large homes earn well above it on wedding weekends, while one-bedroom units trade below. Anchor weekend rates to wedding demand and hold them year-round; use midweek pricing, not weekend discounting, to build occupancy toward the market's 206-night pace.