
Airbnb Occupancy Rate in Idaho Falls, United States, Data & Trends 2026
Curious about the performance of short-term rentals in Idaho Falls, United States? Over the last year, the average occupancy rate was 53% with an average nightly price (ADR) of 212€. Hosts earned on average 3277€ per month.

📩 Send me this report and get it in my inbox every month
90-day occupancy forecast for Idaho Falls so you can update rates and stay ahead of competitors.
Market summary in Idaho Falls
Key metrics to optimize your pricing strategy
Avg. monthly earnings
3277€
$2982 USD
YoY Revenue Change
3%
vs. previous year
Occupancy Rate
53%
~16 days/month
Average Daily Rate
212€
$193 USD
Seasonality Index
186%
demand variation
Best Months
July, June
peak season
Worst Months
November, April
low season
Revenue Management in Idaho Falls
Our AI-powered platform automatically optimizes your rates. Maximize your revenue with intelligent dynamic pricing.
What Idaho Falls's occupancy and nightly prices actually mean
Over the analysis period August 2025 to July 2026, Idaho Falls ran 53% average occupancy against a United States average of about 58% across the 52 American cities we track, equal to roughly 190 booked nights a year. Its average daily rate of 211 is almost exactly the 210 national figure, and average monthly revenue of 3,234 is a little under the 3,370 American average.
On the headline numbers this looks like an unremarkable American market, and that is precisely the trap. The seasonality index of 188 is the highest in this group, which means those averages are the arithmetic of a very strong summer and a very weak winter rather than a description of any actual month. A property here does not earn 3,234 a month; it earns far more than that in July and very little in November. Underwriting on the annual average will overstate the off-season and understate the peak. Revenue rose 2% year on year, a stable result.
Monthly Airbnb occupancy in Idaho Falls
Average occupancy rate by month in Idaho Falls, compared with the same month a year earlier.
| Month | Occupancy | Prior year |
|---|---|---|
| Sep 2025 | 62.7% | 65.3% |
| Oct 2025 | 49.6% | 52% |
| Nov 2025 | 47.8% | 49.2% |
| Dec 2025 | 52.1% | 54.5% |
| Jan 2026 | 48.4% | 47.8% |
| Feb 2026 | 52.6% | 57.3% |
| Mar 2026 | 57.2% | 54% |
| Apr 2026 | 62.2% | 54.8% |
| May 2026 | 66.4% | 60.9% |
| Jun 2026 | 76.5% | 75.7% |
| Jul 2026 | 73.2% | 72.3% |
| Aug 2026 | 62.2% | 62.1% |
Historical Airbnb occupancy in Idaho Falls (last 12 months)
📌 Historical trends reveal seasonal highs – plan accordingly.
Airbnb occupancy forecast in Idaho Falls (next 90 days)
These figures reflect real-time demand in Idaho Falls, helping you plan and price strategically.
Why people book Airbnbs in Idaho Falls
Idaho Falls is the largest city in eastern Idaho and functions primarily as a staging point rather than a destination in itself. It sits on the main approach to the western entrances of Yellowstone and to Grand Teton, with a regional airport and the retail and services that a road trip needs, which makes it the practical overnight base for a very large volume of national-park travel each summer.
The market we track pairs it with Rexburg to the north, a university town that adds its own distinct rhythm of term dates, graduations and parents' weekends. Underneath both sits a steady non-tourist economy, since the area is a significant employment centre for the national laboratory complex and for regional agriculture, which supplies a thin but real layer of extended-stay and contractor demand through the quiet months. The city itself offers the Snake River greenbelt and its falls, pleasant but not the reason most guests are booking.
When Airbnb demand peaks in Idaho Falls
Idaho Falls carries a seasonality index of 188, the most pronounced in this group, and the cause is the national-park calendar rather than the weather in the city. July and June are overwhelmingly the strongest months, matching the window when the park roads are fully open and family travel peaks. November and January are the softest, when park access is limited and there is little reason for a leisure visitor to be in the area.
This is about as concentrated as a market gets. An operator here is running a business that earns most of its money across roughly a hundred days, and the implications follow directly: peak pricing discipline matters more than almost anything else, minimum-stay strategy during July should be set deliberately, and the long off-season is better addressed through monthly lets to contractors and visiting staff than through discounting nightly rates to chase leisure demand that is not there.
Best neighbourhoods for short-term rentals in Idaho Falls
Central Idaho Falls around the Snake River greenbelt and the downtown is the most practical base, walkable to restaurants and close to the main highway approaches, and it holds the steadiest year-round occupancy because it serves business and contractor demand as well as summer visitors. Properties near the regional airport suit short one-night park-transit stays.
Ammon and the eastern suburbs offer larger, newer family houses at lower entry prices, which work well for the group and multi-generational bookings that dominate park travel, provided guests are content to drive. Rexburg to the north is a distinct submarket driven by the university calendar rather than the tourist one, with sharp demand around graduation and move-in weekends. Anything positioned along the corridor heading north-east towards the park entrances trades on drive time, and being materially closer to the gate is worth more to a summer guest than square footage.
Tools & strategies for Idaho Falls
Revenue Management in Idaho Falls
We help you increase revenue in Idaho Falls with pricing algorithms and active monitoring.
Learn moreDynamic Pricing in Idaho Falls
Our engine auto-adjusts prices based on demand and local events in Idaho Falls.
Learn moreChannel Manager in Idaho Falls
Manage listings on Airbnb, Booking.com and Vrbo in one place across Idaho Falls.
Learn moreCheck your Airbnb in United States
And around the world
Other cities in United States
Compare performance across markets – occupancy, nightly prices and seasonality for other destinations in United States.
New York
76%
Los Angeles
75%
Chicago
64%
Houston
56%
Phoenix
63%
Philadelphia
60%
San Diego
65%
Dallas
60%
Austin
58%
Indianapolis
57%
San Francisco
74%
Seattle
64%
Nashville
58%
Denver
68%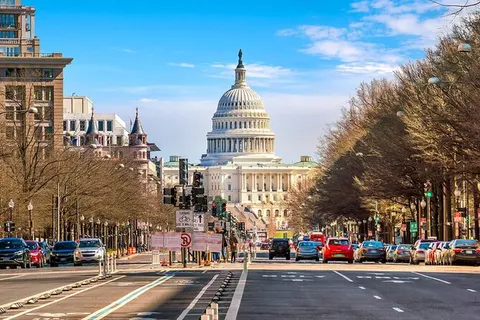
Washington
64%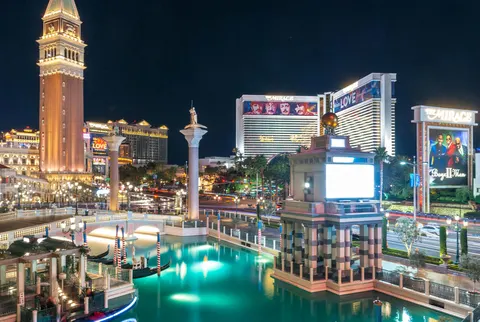
Las Vegas
59%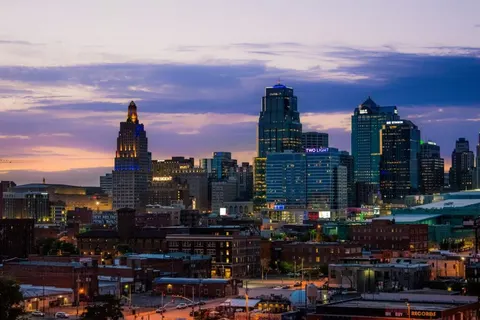
Kansas City
50%
Atlanta
55%
Miami
61%
Tampa
59%
New Orleans
54%
Honolulu
74%
Orlando
61%
Pittsburgh
58%
Scottsdale
63%
Tacoma
61%
Fayetteville
50%
Salt Lake City
66%
Athens
45%
Davenport
61%
Santa Fe
61%
Miami Beach
61%
Daytona Beach
53%
Galveston
43%
Venice
75%
South Lake Tahoe
46%
Durango
49%
Panama City Beach
55%
Santa Rosa Beach
53%
Lahaina
64%
Little River
51%
Alamosa
52%Kill Devil Hills
51%Dripping Springs
58%
Carterville
55%
Big Bear Lake
36%
Rockaway Beach
54%
The Sea Ranch
53%
Springville
48%
Anna Maria
61%Calculate your earnings potential in Idaho Falls
Discover how much more you could earn by optimizing your listings with ListingOK
Your listings
How do we achieve these results?
AI Dynamic Pricing
Occupancy Optimization
Market Analysis
24/7 Expert Support
In line with our best results!
Get your full report
Detailed analysis and personalized recommendations
* Calculations based on 30 days/month. Actual results may vary depending on market, season, property type, and implemented strategy.
Suggest a new city in United States
Frequently asked questions about Airbnb occupancy in Idaho Falls
Over the August 2025 to July 2026 analysis period, occupancy averaged 53%, about 190 booked nights a year, against a United States average of 58% across the 52 American cities we track. The annual figure hides an extreme split between a very strong summer and a very quiet winter.
Average monthly revenue per listing was 3,234, a little under the American average of 3,370, on an average daily rate of 211 that is almost exactly the national figure of 210. Be careful with that monthly number: it is an average of a strong July and a weak November, not a typical month.
July and June are overwhelmingly the strongest months, matching the window when the roads into Yellowstone and Grand Teton are fully open. November and January are the softest. With a seasonality index of 188, the highest in this group, the season is about as concentrated as a market gets.
Central Idaho Falls around the greenbelt and downtown holds the steadiest year-round occupancy because it serves business demand as well as summer visitors. Ammon and the eastern suburbs offer larger family houses at lower entry prices, and Rexburg is a separate submarket driven by the university calendar.
Treat it as a different business rather than a discount problem. The area has a real non-tourist economy in the national laboratory complex and agriculture, so monthly lets to contractors and visiting staff generally serve the quiet months better than cutting nightly rates to chase leisure demand that is not there.