
Airbnb Occupancy Rate in Harwich Port, United States, Data & Trends 2026
Curious about the performance of short-term rentals in Harwich Port, United States? Over the last year, the average occupancy rate was 47% with an average nightly price (ADR) of 393€. Hosts earned on average 4755€ per month.

📩 Send me this report and get it in my inbox every month
90-day occupancy forecast for Harwich Port so you can update rates and stay ahead of competitors.
Market summary in Harwich Port
Key metrics to optimize your pricing strategy
Avg. monthly earnings
4755€
$4327 USD
YoY Revenue Change
3%
vs. previous year
Occupancy Rate
47%
~14 days/month
Average Daily Rate
393€
$358 USD
Seasonality Index
176%
demand variation
Best Months
August, July
peak season
Worst Months
February, January
low season
Revenue Management in Harwich Port
Our AI-powered platform automatically optimizes your rates. Maximize your revenue with intelligent dynamic pricing.
Monthly Airbnb occupancy in Harwich Port
Average occupancy rate by month in Harwich Port, compared with the same month a year earlier.
| Month | Occupancy | Prior year |
|---|---|---|
| Oct 2025 | 36.3% | 38.8% |
| Nov 2025 | 30% | 31.9% |
| Dec 2025 | 31.6% | 30.5% |
| Jan 2026 | 28.9% | 28.3% |
| Feb 2026 | 42.6% | 42% |
| Mar 2026 | 42.6% | 42.5% |
| Apr 2026 | 51% | 51.1% |
| May 2026 | 51.9% | 51.6% |
| Jun 2026 | 68.5% | 69.8% |
| Jul 2026 | 82.1% | 81.9% |
| Aug 2026 | 81.2% | 82.9% |
| Sep 2026 | 47.3% | 46.1% |
Historical Airbnb occupancy in Harwich Port (last 12 months)
📌 Historical trends reveal seasonal highs – plan accordingly.
Airbnb occupancy forecast in Harwich Port (next 90 days)
These figures reflect real-time demand in Harwich Port, helping you plan and price strategically.
Tools & strategies for Harwich Port
Revenue Management in Harwich Port
We help you increase revenue in Harwich Port with pricing algorithms and active monitoring.
Learn moreDynamic Pricing in Harwich Port
Our engine auto-adjusts prices based on demand and local events in Harwich Port.
Learn moreChannel Manager in Harwich Port
Manage listings on Airbnb, Booking.com and Vrbo in one place across Harwich Port.
Learn moreCheck your Airbnb in United States
And around the world
Other cities in United States
Compare performance across markets – occupancy, nightly prices and seasonality for other destinations in United States.
New York
76%
Los Angeles
75%
Chicago
65%
Houston
56%
Phoenix
63%
Philadelphia
60%
San Antonio
56%
San Diego
66%
Dallas
60%
Austin
58%
Indianapolis
57%
San Francisco
74%
Seattle
64%
Nashville
58%
Denver
68%
Washington
65%
Las Vegas
59%
Kansas City
61%
Atlanta
55%
Miami
61%
Tampa
60%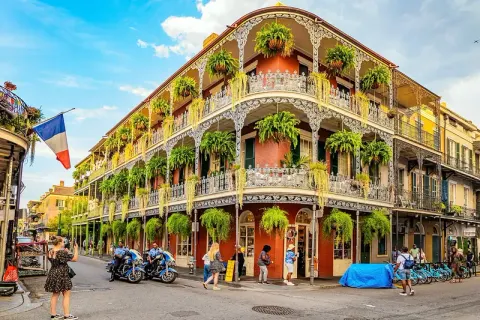
New Orleans
55%
Honolulu
74%
Orlando
61%
Pittsburgh
58%
Scottsdale
63%
Tacoma
62%
Fayetteville
50%
Salt Lake City
66%
Athens
46%
Davenport
61%
Santa Fe
62%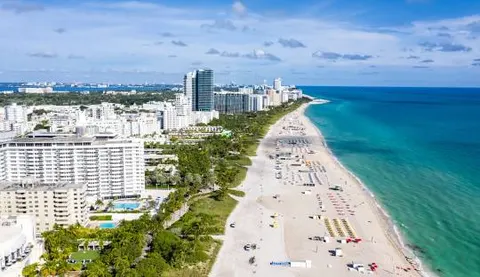
Miami Beach
61%
Daytona Beach
54%
Idaho Falls
54%
Galveston
44%
Venice
75%
South Lake Tahoe
46%
Durango
49%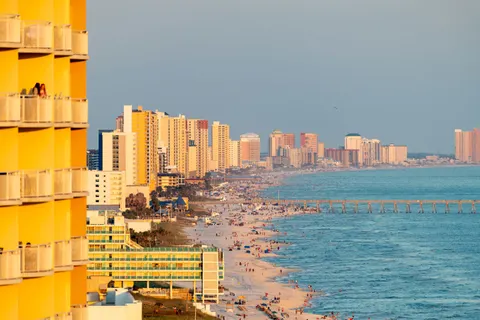
Panama City Beach
56%
Santa Rosa Beach
53%
Lahaina
64%
Little River
52%
Alamosa
53%Kill Devil Hills
52%Dripping Springs
58%
Carterville
55%
Big Bear Lake
37%
Rockaway Beach
54%
The Sea Ranch
53%
Springville
48%
Anna Maria
61%Calculate your earnings potential in Harwich Port
Discover how much more you could earn by optimizing your listings with ListingOK
Your listings
How do we achieve these results?
AI Dynamic Pricing
Occupancy Optimization
Market Analysis
24/7 Expert Support
In line with our best results!
Get your full report
Detailed analysis and personalized recommendations
* Calculations based on 30 days/month. Actual results may vary depending on market, season, property type, and implemented strategy.
Suggest a new city in United States
Frequently asked questions about Airbnb occupancy in Harwich Port
The average occupancy rate in Harwich Port is 47%, based on data from 2025-01 to 2025-12. This means your property will be booked approximately 14 days per month. Compare your listing using our Airbnb Analyzer.
Combine dynamic pricing, flexible calendars and listing optimization. List across multiple OTAs and track KPIs weekly. Our Dynamic Pricing automates updates and captures demand spikes.
The most profitable months are August, July. Raise rates progressively, set minimum stays and align cancellations to risk. Delegate to our Revenue Management for daily adjustments.
Low season in Harwich Port is during February, January. Use length-of-stay discounts, value-add packages and target digital nomads/corporate. Drive visibility and iterate via Market Insights.
The ADR (Average Daily Rate) in Harwich Port is 393€ / $358. Improve it without harming occupancy to lift RevPAR. Strengthen your value proposition and sync pricing to demand. Find windows with Market Insights.
With 47% occupancy and 393€ / $358 ADR, Harwich Port shows potential with estimated monthly revenue of 4755€. Start with Airbnb Analyzer and complement with Market Insights.
Map trade shows, sports and cultural events; raise rates progressively and adjust minimum stays/cancellations. Our Dynamic Pricing bakes these peaks into the model automatically.
Well-connected locations, workspaces, good insulation and consistent reviews win more bookings. See guides on our blog to optimize your listing.
Airbnb and Booking.com dominate; Vrbo, Expedia and local channels add value. Scale safely with a Channel Manager that syncs all your platforms.
Run Mon–Thu rates more competitively, build corporate packages, highlight workspace & internet speed. Offer early-bird discounts and flexible minimum stays.